Logbook Documentation

Version: 1.0.0

You can find the demo version here: https://logbook.solvrtech.id.
You can contact us or register at our SolvrTech Support site should you need any support.

LogBook is not your simple CRUD app. It is meant to be a back office system that will store logs and monitor multiple apps at the same time. It is a supporting tool for both development and production purposes. Even though possible, we don’t recommend deploying LogBook on a shared hosting but rather to install it on top of a VPS or dedicated server environment so that you will have more control (for ex. Amazon EC2, Google Compute Engine, DigitalOcean Droplets, etc).

Before installing LogBook, you should ensure that the following prerequisites are installed properly. For a brief documentation reason, installation/setup of most of these softwares are not covered here.

Mandatory:

  1. PHP 8.1 installed (or greater version) along with the following PHP extensions:
    • Imagick
    • PDO PostgreSQL/MySQL
    • Intl
    • GD
    • cURL
    • OpenSSL
    • Mbstring
    • Iconv
    • Redis
  2. One of the following database:
    • MySQL 8.0 or greater
    • MariaDB 10.11 or greater
    • PostgreSQL 14.0 or greater
  3. NGINX or Apache web server.
  4. Composer 2.3 or greater.
  5. Supervisor or Systemd for background processes manager.

Optional :

The following softwares are not mandatory but we strongly recommend them for a better performance:

  1. Redis 6.0 or greater for better cache mechanism.
  2. Mercure v0.14.10 or greater for instant notifications.

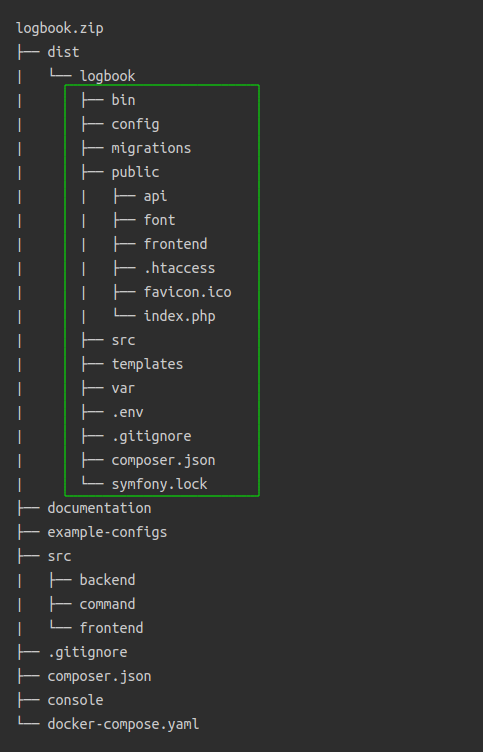
Your downloaded zip file should have the following structure (Image 1):

folder-structure

Image 1. Folder and files structure

  • dist folder contains the build or release version that should be used for deployment.
  • documentation folder contains documentation in HTML version
  • example-configs folder contains examples of all of the config files throughout this documentation (NGINX configs, Systemd, Supervisor, Mercure, etc.)
  • src folder contains the actual source codes for development purposes.
Notes
You should only copy or upload all files and folders inside the dist/logbook folder (marked green in Image 1) into your web root directory. For example, into /var/www/logbook.
How to install ?
1. For basic setup, please read Chapter I
2. For recommended setup, please read Chapter I then continue to Chapter II .

I. Basic Setup

The following setups cover three mandatory things such as web server configs, application installation, and mandatory background processes.

I.1 Web Server Configuration

Notes
The following snippets assume that LogBook is copied or uploaded into /var/www/logbook folder, using domain logbook.com, and using PHP 8.1. Please change them according to your needs.

NGINX

NGINX is our recommended web server to be used with LogBook. In your NGINX site config, add a new location block to handle request access for the backend and frontend part.

Location blocks handler for backend requests:

location /api {
    root /var/www/logbook/public;
    try_files $uri $uri/ /index.php?$query_string;
}

Location blocks handler for frontend requests:

location / {
    root /var/www/logbook/frontend;
    try_files $uri $uri/ /index.html;

    expires 1y;
    add_header Cache-Control "public, no-transform";
}

Apache

You can also use the Apache web server to power LogBook. Here is an example of the virtual host configuration for the backend part:

<VirtualHost *:80 *:8000>
        ServerName localhost:8000

        DocumentRoot /var/www/logbook/public
        <Directory /var/www/logbook/public>
                Options Indexes FollowSymLinks
                AllowOverride All
                Require all granted

                <IfModule mod_rewrite.c>
                        RewriteEngine On
                        RewriteCond %{REQUEST_FILENAME} !-f
                        RewriteRule ^(.*)$ index.php [QSA,L]
                </IfModule>
        </Directory>

        <FilesMatch \.php$>
                SetHandler "proxy:unix:/run/php/php8.1-fpm.sock|fcgi://localhost/"
        </FilesMatch>

        ErrorLog /var/log/apache2/logbook_error.log
</VirtualHost>

Here is an example of the virtual host configuration for the frontend side:

<VirtualHost *:80>
        ServerName logbook.com

        DocumentRoot /var/www/logbook/public/frontend
        <Directory /var/www/logbook/public/frontend>
                Options Indexes FollowSymLinks
                AllowOverride All
                Require all granted

                <IfModule mod_rewrite.c>
                        RewriteEngine On
                        RewriteCond %{DOCUMENT_ROOT}%{REQUEST_URI} -f [OR]
                        RewriteCond %{DOCUMENT_ROOT}%{REQUEST_URI} -d
                        RewriteRule ^ - [L]  
                        RewriteRule ^ /index.html [L]
                </IfModule>
        </Directory>

        <Location /api>
                ProxyPass http://localhost:8000/api
                ProxyPassReverse http://localhost:8000/api
                ProxyPassReverseCookieDomain localhost logbook.com
                ProxyPassReverseCookiePath / /api
                Header always edit Set-Cookie "(.*)" "$1; Path=/;"
        </Location>

        ErrorLog /var/log/apache2/logbook_error.log
</VirtualHost>

I.2 Installation

Once you copied or upload all the files and folders inside dist/logbook/ into your site or web root directory, for example into /var/www/logbook/, run the following command at the web root directory:

sudo chmod ug+x bin/install.sh && ./bin/install.sh

install.sh is a bash script that will help you to set the correct files and folders permissions in order to make LogBook to work properly and securely. It will also guide you through all of the necessary steps, including dependencies installation, application configuration, migrations, and creation of an initial administrator user.

I.3 Background Processes

LogBook has three background processes that need to be configured by using either Systemd or Supervisor (choose one). They will do processing, followed by a sleep, then repeat it again forever.

You can choose one of the following options, by using Systemd or Supervisor.

Notes

Most of the following snippets usewww-data as the default web server user, and also use it as the same background process user. Please change it if you have a different web server user according to your system.

Using Systemd

Create a new systemd service file, for example /etc/systemd/system/health-check.service, then add the following configurations into the file:

[Unit]
Description=LogBook Health Check
After=network.target

[Service]
ExecStart=/usr/bin/php /var/www/logbook/bin/console app:health-status:check
WorkingDirectory=/var/www/logbook
User=www-data
Restart=always

[Install]
WantedBy=multi-user.target

Once the service file is saved, run the following command anywhere in order to start the service (also auto start it during a system reboot):

sudo systemctl start health-check && sudo systemctl enable health-check

Then create another service file for database backup service, for example /etc/systemd/system/logbook-backup.service:

[Unit]
Description=LogBook Database Backup
After=network.target

[Service]
ExecStart=/usr/bin/php /var/www/logbook/bin/console app:backup:start
WorkingDirectory=/var/www/logbook
User=www-data
Restart=always

[Install]
WantedBy=multi-user.target

Start the service and enable it during system reboot:

sudo systemctl start logbook-backup && sudo systemctl enable logbook-backup

Finally - create the last service file for purging expired records, for example /etc/systemd/system/logbook-clear-expired.service:

[Unit]
Description=LogBook Clear Expired Record
After=network.target

[Service]
ExecStart=/usr/bin/php /var/www/logbook/bin/console app:expired-record:clear
WorkingDirectory=/var/www/logbook
User=www-data
Restart=always

[Install]
WantedBy=multi-user.target

then start the service and enable it during system reboot:

sudo systemctl start logbook-clear-expired && sudo systemctl enable logbook-clear-expired

Using Supervisor

If you choose to use Supervisor,create a new configuration file for the health check service, for example /etc/supervisor/conf.d/logbook-health-status-check.conf.

Add the following configuration settings to the file:

[program:logbook-health-check]
command=php /var/www/logbook/bin/console app:health-status:check
directory=/var/www/logbook
autostart=true
autorestart=true
stderr_logfile=/var/log/logbook-health-check.err.log
stdout_logfile=/var/log/logbook-health-check.out.log
user=www-data

Then create configuration file for the database backup service, for example /etc/supervisor/conf.d/logbook-backup.conf with the following configurations:

[program:logbook-backup]
command=php /var/www/logbook/bin/console app:backup:start
directory=/var/www/logbook
autostart=true
autorestart=true
stderr_logfile=/var/log/logbook-backup.err.log
stdout_logfile=/var/log/logbook-backup.out.log
user=www-data

Finally, create the last configuration file for clearing expired records, for example /etc/supervisor/conf.d/logbook-expired-clear.conf with the following configurations:

[program:logbook-expired-clear]
command=php /var/www/logbook/bin/console app:expired-record:clear
directory=/var/www/logbook
autostart=true
autorestart=true
stderr_logfile=/var/log/logbook-expired-clear.err.log
stdout_logfile=/var/log/logbook-expired-clear.out.log
user=www-data

When all configuration files are saved, run the following commands anywhere to start them:

sudo supervisorctl reread && sudo supervisorctl update && sudo supervisorctl start logbook-health-check logbook-backup logbook-expired-clear

That’s it! The process will also auto start on a system restart. In order to check the status of the process, run the following command:

sudo supervisorctl status logbook-health-check logbook-backup logbook-expired-clear

I.4 Optional: Disabling CDN Usage

By default, LogBook loads some static assets from CDN (ex. Google Fonts). This approach could be considered as a violation from a data protection perspective, for example in EU GDPR. If you choose to serve these assets from your server instead, you just need to modify the <head> part of the public/index.html file.

Comment or remove the following section:

<!-- using CDN -->
<link href="https://fonts.googleapis.com/css2?family=Open+Sans:wght@300;400;500;700&display=swap" rel="stylesheet"/>
<link href="https://fonts.googleapis.com/css2?family=Material+Symbols+Outlined" rel="stylesheet" />
<link rel="stylesheet" href="https://cdn.jsdelivr.net/npm/[email protected]/font/bootstrap-icons.css" />
<link rel="stylesheet" href="https://cdn.jsdelivr.net/gh/devicons/[email protected]/devicon.min.css" />

And uncomment the section underneath it:

<!-- <link rel="stylesheet" href="assets/fonts/open-sans/open-sans.min.css">
<link rel="stylesheet" href="assets/fonts/material-symbol/material-symbol.min.css">
<link rel="stylesheet" href="assets/fonts/bootstrap-icons/bootstrap-icons.min.css">
<link rel="stylesheet" href="assets/fonts/devicons/devicon.min.css"> --> 

So that the final <head> part of index.html file will look like this:

<!-- using CDN -->
<!-- <link href="https://fonts.googleapis.com/css2?family=Open+Sans:wght@300;400;500;700&display=swap" rel="stylesheet"/>
<link href="https://fonts.googleapis.com/css2?family=Material+Symbols+Outlined" rel="stylesheet" />
<link rel="stylesheet" href="https://cdn.jsdelivr.net/npm/[email protected]/font/bootstrap-icons.css" />
<link rel="stylesheet" href="https://cdn.jsdelivr.net/gh/devicons/[email protected]/devicon.min.css" /> -->

<!-- self hosted -->
<link rel="stylesheet" href="assets/fonts/open-sans/open-sans.min.css">
<link rel="stylesheet" href="assets/fonts/material-symbol/material-symbol.min.css">
<link rel="stylesheet" href="assets/fonts/bootstrap-icons/bootstrap-icons.min.css">
<link rel="stylesheet" href="assets/fonts/devicons/devicon.min.css">

I.5 Example: Web Server Configuration (Basic Setup)

The following is an example for NGINX and Apache Virtual Host config where the installation directory is located at /var/www/logbook, the domain name is logbook.com, and using PHP 8.1.

NGINX basic setup without SSL

server {
    listen 80;
    listen [::]:80;
    server_name logbook.com;
    root /var/www/logbook/public;

    add_header X-Frame-Options "SAMEORIGIN";
    add_header X-XSS-Protection "1; mode=block";
    add_header X-Content-Type-Options "nosniff";

    index index.html index.htm index.php;

    charset utf-8;

    client_max_body_size 100m;

    # handles backend requests
    location /api {
        root /var/www/logbook/public;
        try_files $uri $uri/ /index.php?$query_string;
    }

    # handles frontend requests
    location / {
        root /var/www/logbook/public/frontend;
        try_files $uri $uri/ /index.html;
    }

    location = /favicon.ico { access_log off; log_not_found off; }
    location = /robots.txt  { access_log off; log_not_found off; }

    error_page 404 /index.php;

    location ~ \.php$ {
        fastcgi_pass unix:/var/run/php/php8.1-fpm.sock;
        fastcgi_index index.php;
        fastcgi_param SCRIPT_FILENAME $realpath_root$fastcgi_script_name;
        include fastcgi_params;
        fastcgi_buffer_size 128k;
        fastcgi_buffers 4 256k;
    }

    location ~ /\.(?!well-known).* {
        deny all;
    }
}

NGINX basic setup with SSL

server {
    # SSL configuration
    listen [::]:443 ssl;
    listen 443 ssl;
    ssl_certificate /path/to/ssl_certificate.crt;
    ssl_certificate_key /path/to/ssl_private_key.key;

    server_name logbook.com;
    root /var/www/logbook/public;

    add_header X-Frame-Options "SAMEORIGIN";
    add_header X-XSS-Protection "1; mode=block";
    add_header X-Content-Type-Options "nosniff";

    index index.html index.htm index.php;

    charset utf-8;

    client_max_body_size 100m;

    # handles backend requests
    location /api {
        root /var/www/logbook/public;
        try_files $uri $uri/ /index.php?$query_string;
    }

    # handles frontend requests
    location / {
        root /var/www/logbook/public/frontend;
         try_files $uri $uri/ /index.html;
    }

    location = /favicon.ico { access_log off; log_not_found off; }
    location = /robots.txt  { access_log off; log_not_found off; }

    error_page 404 /index.php;

    location ~ \.php$ {
        fastcgi_pass unix:/var/run/php/php8.1-fpm.sock;
        fastcgi_index index.php;
        fastcgi_param SCRIPT_FILENAME $realpath_root$fastcgi_script_name;
        include fastcgi_params;
        fastcgi_buffer_size 128k;
        fastcgi_buffers 4 256k;
    }

    location ~ /\.(?!well-known).* {
        deny all;
    }
}

# Redirect HTTP to HTTPS
server {
    if ($host = logbook.com) {
        return 301 https://$host$request_uri;
    }

    listen 80;
    listen [::]:80;
    server_name logbook.com;
    return 404;
}

Basic setup for Apache Virtual Host without SSL

<VirtualHost *:80>
        ServerName logbook.com

        DocumentRoot /var/www/logbook/public/frontend
        <Directory /var/www/logbook/public/frontend>
                Options Indexes FollowSymLinks
                AllowOverride All
                Require all granted

                <IfModule mod_rewrite.c>
                        RewriteEngine On
                        RewriteCond %{DOCUMENT_ROOT}%{REQUEST_URI} -f [OR]
                        RewriteCond %{DOCUMENT_ROOT}%{REQUEST_URI} -d
                        RewriteRule ^ - [L]  
                        RewriteRule ^ /index.html [L]
                </IfModule>
        </Directory>

        <Location /api>
                ProxyPass http://localhost:8000/api
                ProxyPassReverse http://localhost:8000/api
                ProxyPassReverseCookieDomain localhost logbook.com
                ProxyPassReverseCookiePath / /api
                Header always edit Set-Cookie "(.*)" "$1; Path=/;"
        </Location>

        ErrorLog /var/log/apache2/logbook_error.log
</VirtualHost>

<VirtualHost *:80 *:8000>
        ServerName localhost:8000

        DocumentRoot /var/www/logbook/public
        <Directory /var/www/logbook/public>
                Options Indexes FollowSymLinks
                AllowOverride All
                Require all granted

                <IfModule mod_rewrite.c>
                        RewriteEngine On
                        RewriteCond %{REQUEST_FILENAME} !-f
                        RewriteRule ^(.*)$ index.php [QSA,L]
                </IfModule>
        </Directory>

        <FilesMatch \.php$>
                SetHandler "proxy:unix:/run/php/php8.1-fpm.sock|fcgi://localhost/"
        </FilesMatch>

        ErrorLog /var/log/apache2/logbook_error.log
</VirtualHost>

Basic setup for Apache Virtual Host with SSL

<VirtualHost *:80>
        ServerName logbook.com
        Redirect permanent / https://logbook.com/
</VirtualHost>

<VirtualHost *:443>
        ServerName logbook.com

        # SSL configuration
        SSLEngine on
        SSLCertificateFile /path/to/certificate.crt
        SSLCertificateKeyFile /path/to/private.key

        DocumentRoot /var/www/logbook/public/frontend
        <Directory /var/www/logbook/public/frontend>
                Options Indexes FollowSymLinks
                AllowOverride All
                Require all granted

                <IfModule mod_rewrite.c>
                        RewriteEngine On
                        RewriteCond %{DOCUMENT_ROOT}%{REQUEST_URI} -f [OR]
                        RewriteCond %{DOCUMENT_ROOT}%{REQUEST_URI} -d
                        RewriteRule ^ - [L]  
                        RewriteRule ^ /index.html [L]
                </IfModule>
        </Directory>

        <Location /api>
                ProxyPass http://localhost:8000/api
                ProxyPassReverse http://localhost:8000/api
                ProxyPassReverseCookieDomain localhost logbook.com
                ProxyPassReverseCookiePath / /api
                Header always edit Set-Cookie "(.*)" "$1; Path=/; Secure"
        </Location>

        ErrorLog /var/log/apache2/logbook_error.log
</VirtualHost>

<VirtualHost *:80 *:8000>
        ServerName localhost:8000

        DocumentRoot /var/www/logbook/public
        <Directory /var/www/logbook/public>
                Options Indexes FollowSymLinks
                AllowOverride All
                Require all granted

                <IfModule mod_rewrite.c>
                        RewriteEngine On
                        RewriteCond %{REQUEST_FILENAME} !-f
                        RewriteRule ^(.*)$ index.php [QSA,L]
                </IfModule>
        </Directory>

        <FilesMatch \.php$>
                SetHandler "proxy:unix:/run/php/php8.1-fpm.sock|fcgi://localhost/"
        </FilesMatch>

        ErrorLog /var/log/apache2/logbook_error.log
</VirtualHost>

II. Recommended Setup

The basic setup as described in Chapter I is meant for a quick and minimal installation. We strongly recommend the following additional steps and softwares to be used and configured, as they can bring performance enhancement, and to be well prepared to receive many incoming logs data while still being able to send alerts as fast as possible.

Our recommendations are:

  1. Using a better cache adapter and queueing mechanism (e.g. Redis)
  2. Using Mercure for instant in-app notifications

II.1 Cache and Messenger

LogBook can use any supported cache adapter as defined here. While being optional, we strongly recommend using a non-filesystem type of cache provider, for example by using Redis or Memcached.

Cache storage

To use Redis as the cache storage in LogBook, make sure Redis is installed first then add the following configuration in /config/packages/cache.yaml file inside your LogBook folder :

framework:
    cache:
        app: cache.adapter.redis
        default_redis_provider: 'redis://127.0.0.1:6379'

Assuming your Redis installation is available at 127.0.0.1:6379 (localhost using port 6379). After changing the cache configuration, don’t forget to run the following command :

php bin/console cache:clear

in your LogBook root folder (for ex. /var/www/logbook). It will refresh the current application's cache, ensuring that any changes made to the code or configuration are reflected correctly.

Messenger

Messenger provides a message bus with the ability to send messages and then handle them immediately in your application or send them through transports (e.g. queues) to be handled later.

If you want to handle a message asynchronously, and use Redis as messenger transport, add this configuration to /config/packages/messenger.yaml file inside your LogBook folder..

framework:
    messenger:
        transports:
            async: 'redis://127.0.0.1:6379'
        routing:
            'Symfony\Component\Mailer\Messenger\SendEmailMessage': async

Symfony messenger component provides a message bus to send messages such as reset password links, 2FA tokens, and alert messages. The messenger process must be added to the process manager that your server uses (e.g., Systemd or Supervisor).

Notes
The following snippets use www-data as the default background process user, the same user as the web server user. Please change it according to your system.

Using systemd

This configuration is provided as a systemd unit file for managing the LogBook Messenger service.

[Unit]
Description=LogBook Messenger
After=network.target

[Service]
ExecStart=/usr/bin/php /var/www/logbook/bin/console messenger:consume async --time-limit=3600
WorkingDirectory=/var/www/logbook
User=www-data
Restart=always
RestartSec=3
LimitNOFILE=4096

[Install]
WantedBy=multi-user.target

Make sure to save the unit file with a .service extension, such as logbook-messenger.service, and place it in the appropriate Systemd directory according to your system, for example /etc/systemd/system/.

Then, you can use Systemd commands anywhere to start the service:

sudo systemctl start logbook-messenger 

To auto start the service on a system reboot, you can run:

sudo systemctl enable logbook-messenger 

Using Supervisor

Assuming that you put the LogBook installation in the /var/www/logbook folder, you will need to create a new configuration file in the /etc/supervisor/conf.d/ directory as follows:

[program:logbook-messenger]
process_name=%(program_name)s_%(process_num)02d
command=php /var/www/logbook/bin/console messenger:consume async --time-limit=3600
autostart=true
autorestart=true
user=www-data
numprocs=8
redirect_stderr=true
stdout_logfile=/tmp/logbook.log
stopwaitsecs=3600

As you can see on the snippet above, we set 8 as the number of background processes that will run the given command. The --time-limit option is used in order to stop the worker process when the given time limit is reached (in seconds). If a message is being handled at that time, the process will stop after the processing is finished.

Once you’ve saved the file, run the following commands to start the process:

sudo supervisorctl reread && sudo supervisorctl update && sudo supervisorctl start logbook-messenger

That’s it - the process will run automatically on a system restart. In order to check the status of the process, run the following command:

sudo supervisorctl status logbook-messenger

II.2 Instant Notifications

Mercure is a hub or a protocol allowing services to push data or payload to other HTTP clients in a convenient, fast, reliable, and efficient way. LogBook can use Mercure to push alert messages from backend to frontend, enabling instant in-app notification which is more convenient than the periodic data polling method (sending periodic requests from frontend side). The latter is the default method LogBook will use when Mercure is not used.

Please note that using Mercure in LogBook is optional. Using a self-hosted Mercure as described in the following steps here is also optional, since Mercure provides a paid Managed Mercure Hub service as an alternative. You might want to use the paid service if you find the Mercure installation is difficult.

Notes
If you decide to use paid Managed Mercure Hub service, you can skip the following steps and go straight to step 5.

1. Installation

If you decide to self-hosting it, Mercure is available in various forms as you can see here including the prebuilt binary, Docker image, and so on. The following example shows you how to use Mercure in prebuilt binary with Supervisor or Systemd and install it in the same server as LogBook, making Mercure accessible from a different port (8080).
First you need to download the prebuilt binary archive from their release page. The following example uses Linux64 with the wget command:

wget https://github.com/dunglas/mercure/releases/download/v0.14.10/mercure_0.14.10_Linux_x86_64.tar.gz

Once download is finished, extract the archive by using tar command:

tar -xvf mercure_0.14.10_Linux_x86_64.tar.gz 

then move the extracted binary to /usr/local/bin/ directory using the sudo command:

sudo mv mercure /usr/local/bin/

2. Create a Caddyfile

Create a config file for Mercure, for ex: /etc/caddy/Caddyfile:

{
        {$GLOBAL_OPTIONS}
}

{$SERVER_NAME:localhost}

log {
        format filter {
                wrap console
                fields {
                        uri query {
                                replace authorization REDACTED
                        }
                }
        }
}

{$EXTRA_DIRECTIVES}

route {
        encode zstd gzip

        mercure {
                # Transport to use (default to Bolt)
                transport_url {$MERCURE_TRANSPORT_URL:bolt://mercure.db}
                # Publisher JWT key
                publisher_jwt !ChangeThisMercureHubJWTSecretKey!
                # Subscriber JWT key
                subscriber_jwt !ChangeThisMercureHubJWTSecretKey!
                # Permissive configuration for the development environment
                cors_origins *
                # Extra directives
                {$MERCURE_EXTRA_DIRECTIVES}
        }

        header / Content-Type "text/html; charset=utf-8"
        respond / `<!DOCTYPE html>
        <html lang=en>
        <meta charset="utf-8">
        <meta name="robots" content="noindex">
        <title>Welcome to Mercure</title>
        <h1>Welcome to Mercure</h1>
        <p>The URL of your hub is <code>/.well-known/mercure</code>.
        Read the documentation on <a href="https://mercure.rocks">Mercure.rocks, real-time apps made easy</a>.`

        respond /healthz 200
        respond "Not Found" 404
}
  • The provided configuration is a Caddyfile used by the Caddy web server that is used by Mercure. The Caddyfile is a text-based configuration file that defines how Caddy should handle incoming HTTP requests.
  • publisher_jwt and subscriber_jwt specify the JWT keys for publishers and subscribers, respectively and don't forget to keep anonymous as you can see in the snippet above to allow subscribers without authentication to connect.
  • In the snippet above, you will have to change the value for publisher_jwt and subscriber_jwt (for ex. !ChangeThisMercureHubJWTSecretKey!)

3. Background process setup

Notes
The following snippets use 8080 as the background process port, Please change it according to your needs.

If you are using Supervisor:

Create a new supervisor config for example in /etc/supervisor/conf.d/mercure.conf

[program:mercure]
environment=USE_FORWARDED_HEADERS=1, SERVER_NAME=:8080,
command=/usr/local/bin/mercure run --config /etc/caddy/Caddyfile
autostart=true
autorestart=true
redirect_stderr=true
stdout_logfile=/var/log/mercure.out.log
stderr_logfile=/var/log/mercure.err.log

This configuration instructs Supervisor to manage the execution, monitoring, and automatic restart of the mercure program. It sets environment variables, specifies the command to run, and configures logging options for both the standard output and standard error of the program.
Then run the following commands to start the process:

sudo supervisorctl reread && sudo supervisorctl update && sudo supervisorctl start mercure

If you use Systemd instead of Supervisor:

then create a new Systemd service for example in /etc/systemd/system/mercure.service

[Unit]
Description=Mercure Service
After=network.target

[Service]
Environment=USE_FORWARDED_HEADERS=1 SERVER_NAME=:8080
ExecStart=/usr/local/bin/mercure run --config /etc/caddy/Caddyfile
Restart=always
RestartSec=3
StandardOutput=file:/var/log/mercure.out.log
StandardError=file:/var/log/mercure.err.log

[Install]
WantedBy=multi-user.target

Run the following command anywhere to start the service:

sudo systemctl start mercure

To auto start the service on a system reboot, you can run:

sudo systemctl enable mercure

4. Proxy configuration

You can use NGINX or Apache for this purpose. Please note that they are using port 8080 as the default Mercure’s background process port as defined in Systemd or Supervisor config previously.

NGINX configuration:

location /.well-known/mercure {
    proxy_pass http://localhost:8080;
    proxy_set_header Host $host;
    proxy_set_header X-Real-IP $remote_addr;
    proxy_set_header X-Forwarded-For $proxy_add_x_forwarded_for;
    proxy_set_header X-Forwarded-Proto $scheme;
}

In this configuration, NGINX is set to act as a reverse proxy for requests to Mercure. When a request is made to /well-known/mercure, NGINX will pass the request to the backend server running on http://localhost:8080.

Apache configuration:

<Location /.well-known/mercure>
        ProxyPass http://localhost:8080/.well-known/mercure
        ProxyPassReverse http://localhost:8080/.well-known/mercure
</Location>

Make sure to restart the Nginx/Apache service afterwards.

5. Using Mercure in LogBook

In your LogBook app, set Mercure as an alert channel in config/service.yaml so that notifications will be sent through Mercure:

parameters:
    alert_channel:
        - 'mercure' 

then connect the Mercure hub with LogBook by adding the following configuration to the .env file:

MERCURE_URL=https://logbook.com/.well-known/mercure
MERCURE_PUBLIC_URL=https://logbook.com/.well-known/mercure
MERCURE_JWT_SECRET="!ChangeThisMercureHubJWTSecretKey!"
Notes
The snippet above assumes https://logbook.com as the domain name of your LogBook installation. Please change it accordingly.
  • MERCURE_URL=https://logbook.com/.well-known/mercure is the URL that is used to connect to the Mercure hub. The Mercure hub is responsible for handling real-time updates and event publishing in the LogBook application.
  • MERCURE_PUBLIC_URL=https://logbook.com/.well-known/mercure is the URL that clients can use to connect to the Mercure hub for subscribing to real-time updates.
  • MERCURE_JWT_SECRET="!ChangeThisMercureHubJWTSecretKey!" Change the value according to the value of publisher_jwt inside your /etc/caddy/Caddyfile. This sets the MERCURE_JWT_SECRET environment variable to the specified JWT secret key used for authenticating with the Mercure hub.
    Then finally, you need to run the following command:
php bin/console cache:clear
III. Features

Important notes !
Once LogBook is installed and accessible, please sign in by using the administrator account that you’ve made by using the command line installer, check the global LogBook settings menu (more on Chapter III.9) and set them correctly. For example, LogBook will need the correct SMTP settings in order to be able to send outgoing messages, invite users, etc.

LogBook employs two user roles:

Admin
As its name implies, a super user which is basically able to access and perform any features.

Standard
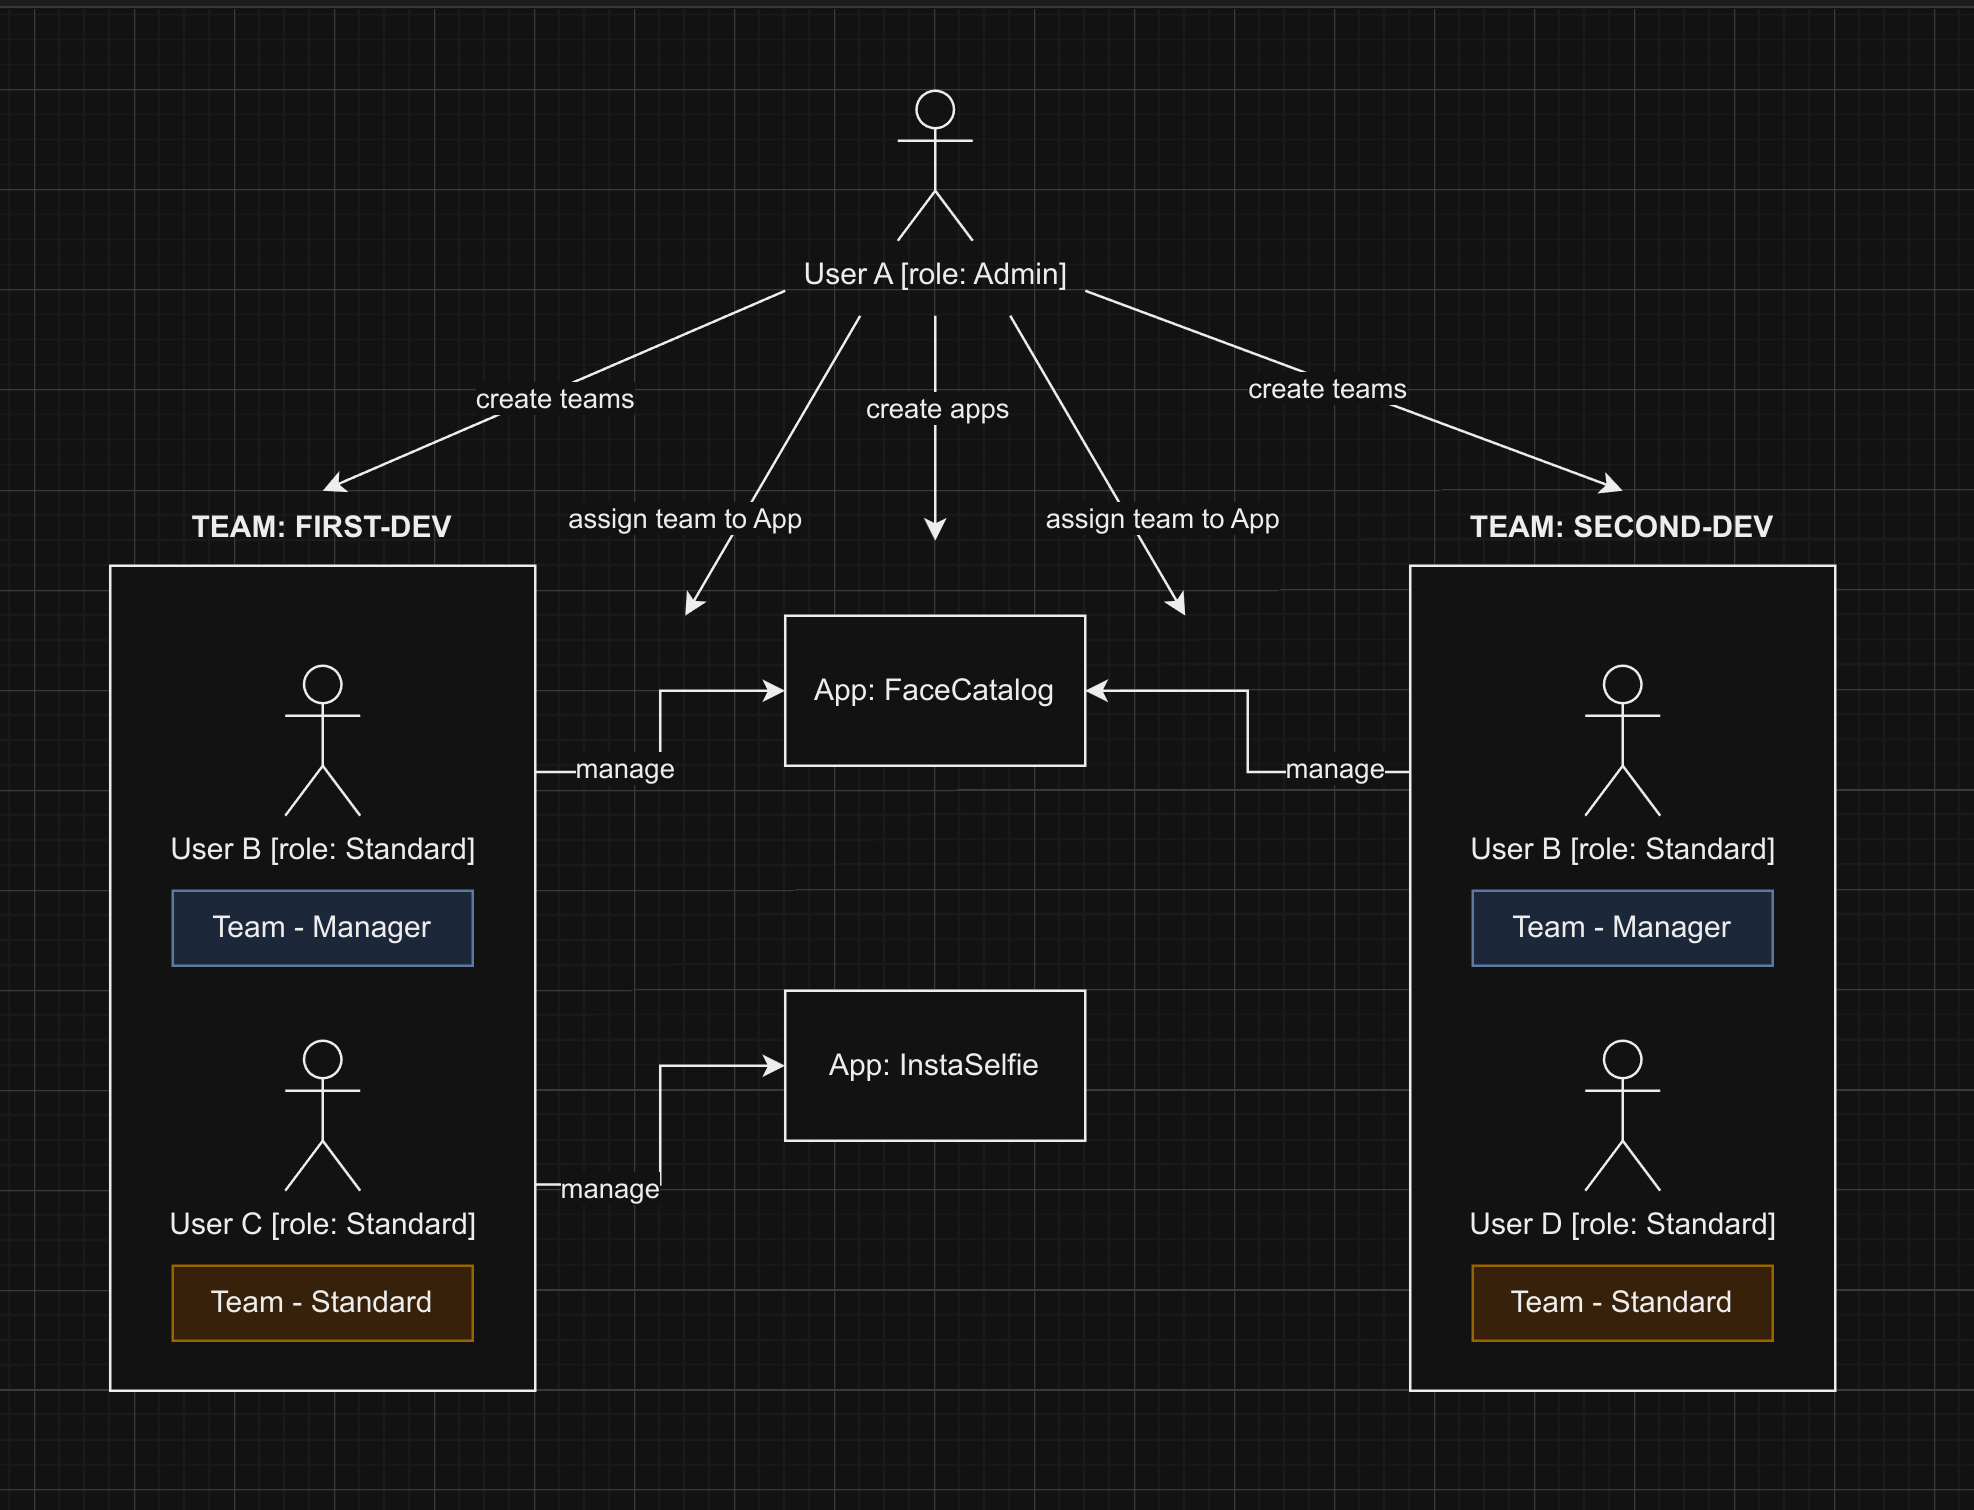
Users with a standard role would not be able to perform administrative tasks, such as managing user accounts, global LogBook settings, and so on. In order to access or manage additional features such as Apps, Logs, and Health Status, each standard user must be registered under team(s). Each team then can be assigned into one or more apps as needed, which is possible only by the LogBook admin.

The following diagram shows the brief concept:

User Roles and Team Roles

Image 2. User Roles and Team Roles

Teams
Instead of setting individual access for Logs and Health-status monitoring, LogBook assigns the required privileges for teams. A single team is a collection of users - mostly users with a standard role - with each member must be assigned one of the following team role:

  • Team-standard
  • A standard member in a team where he/she can only view app statistics and get alerts from logs monitoring or health-checks results as configured by the team-manager.
  • Team-manager
  • A team manager has all Team-standard privileges with additional privileges such as managing app settings, membership, and alerts configuration.
Please note:
Only Admin can create apps, teams, and then finally assign one or more teams into apps. Each team member will then have access to the assigned apps of their team(s).

The diagram in Image 2 above illustrates the following scenario:

  • User A, which is a LogBook admin, created 2 teams: First-Dev and Second-Dev.
  • User A added User B to the First-Dev and Second-Dev team, and assigned him as their Team-manager.
  • User A is also able to register apps: he created FaceCatalog and InstaSelfie.
  • He assigned both the First-Dev and Second-Dev team to manage the FaceCatalog app.
  • He assigned the First-Dev team to manage the InstaSelfie app.
  • As a Team-manager, User B is capable of managing membership of his team. He added User C to his First-Dev team and User D to his Second-Dec team.
  • Being a Team-standard user, User C and D should only be able to view application statistics such as Logs and Health status.
  • User C is granted read-access for both FaceCatalog and InstaSelfie apps.
  • User D is granted read-access for InstaSelfie app only.

III.1 Authentication

Basic authentication

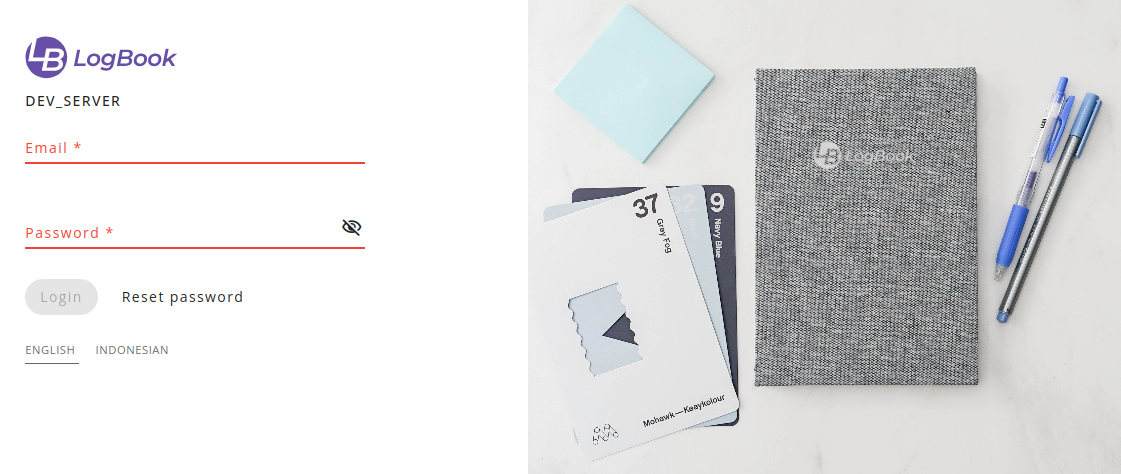
LogBook uses a traditional authentication method by sending the user's credentials: email and password by default (Image 3). It can also be configured to use Two-Factor Authentication (2FA) that provides a more secure authentication process.

login

Image 3. Login page

Two-Factor Authentication via Email (Globally)

Two-Factor Authentication (2FA) is a security mechanism that requires users to do additional authentication in order to access resources or services. LogBook has a global setting for the 2FA authentication method which uses email-based token as the secondary authentication process in order to improve security.

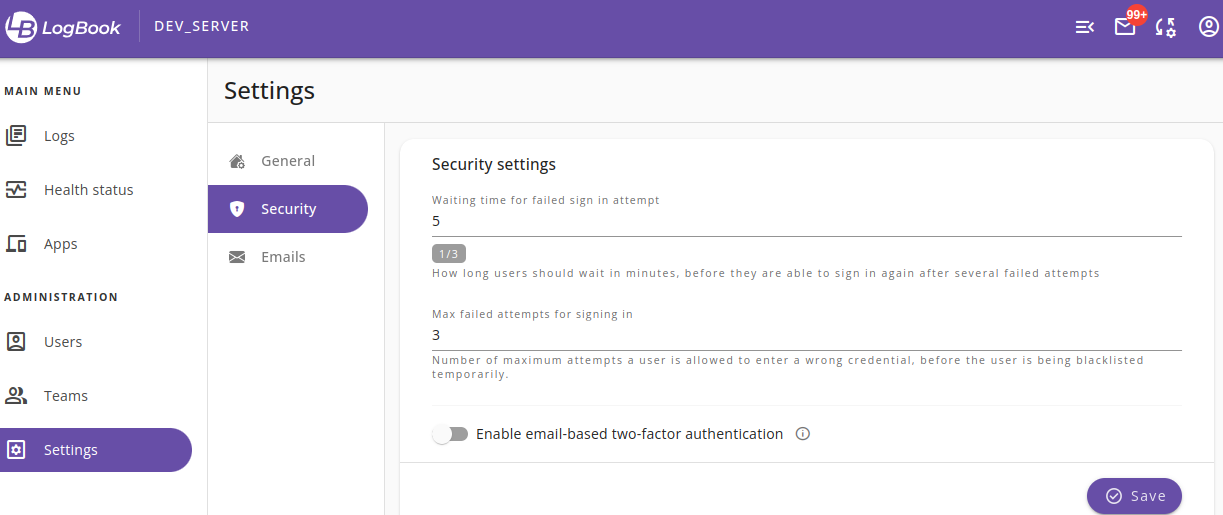
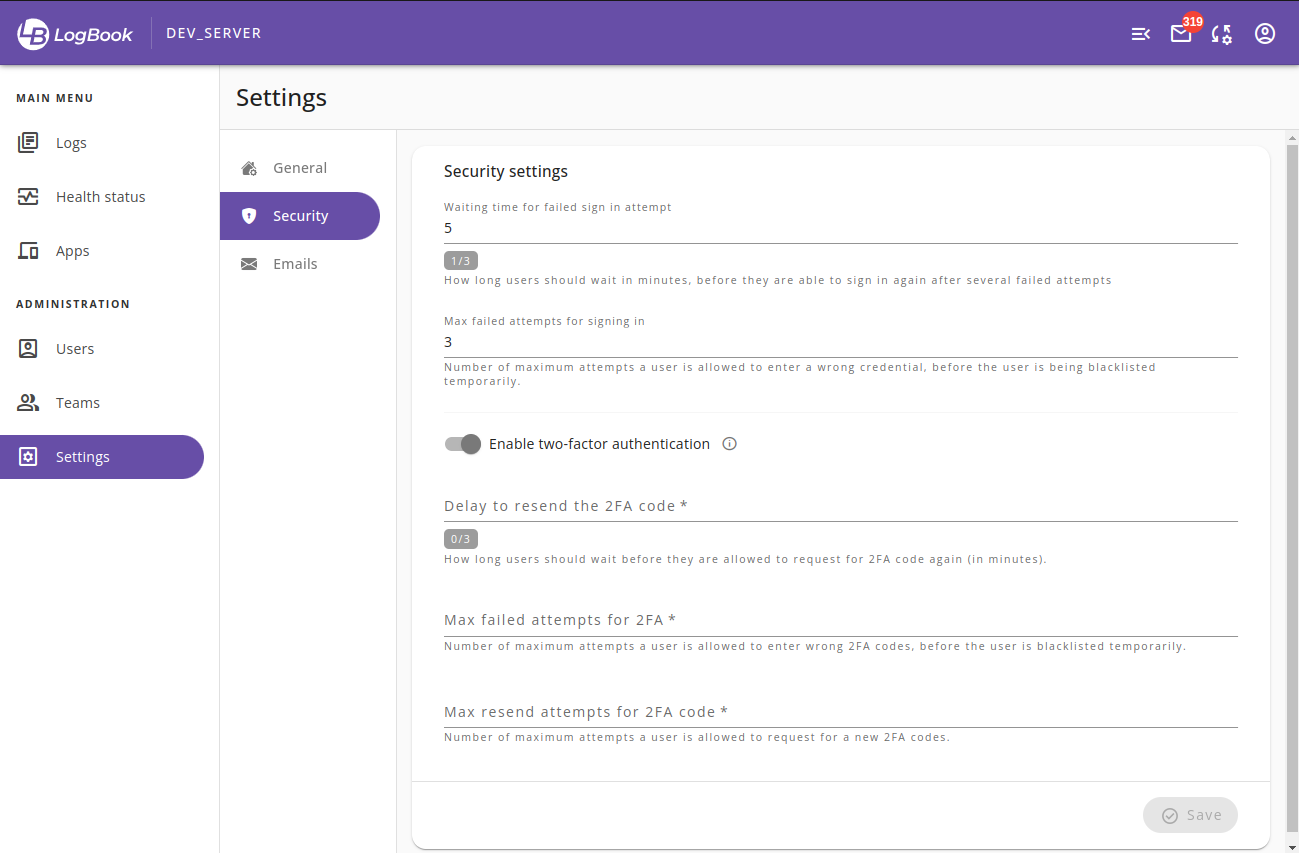
To activate this feature, go to the Security section under Settings page (Image 4). Activate the Enable email-based two-factor authentication toggle, then all users will have to submit an email-based token after a successful sign in attempt. The process is mandatory unless users enabled Google Authenticator which is another 2FA option, but for personal choice.

Security-settings

Image 4. Security section of settings page

Two-Factor Authentication via Google Authenticator (Personal)

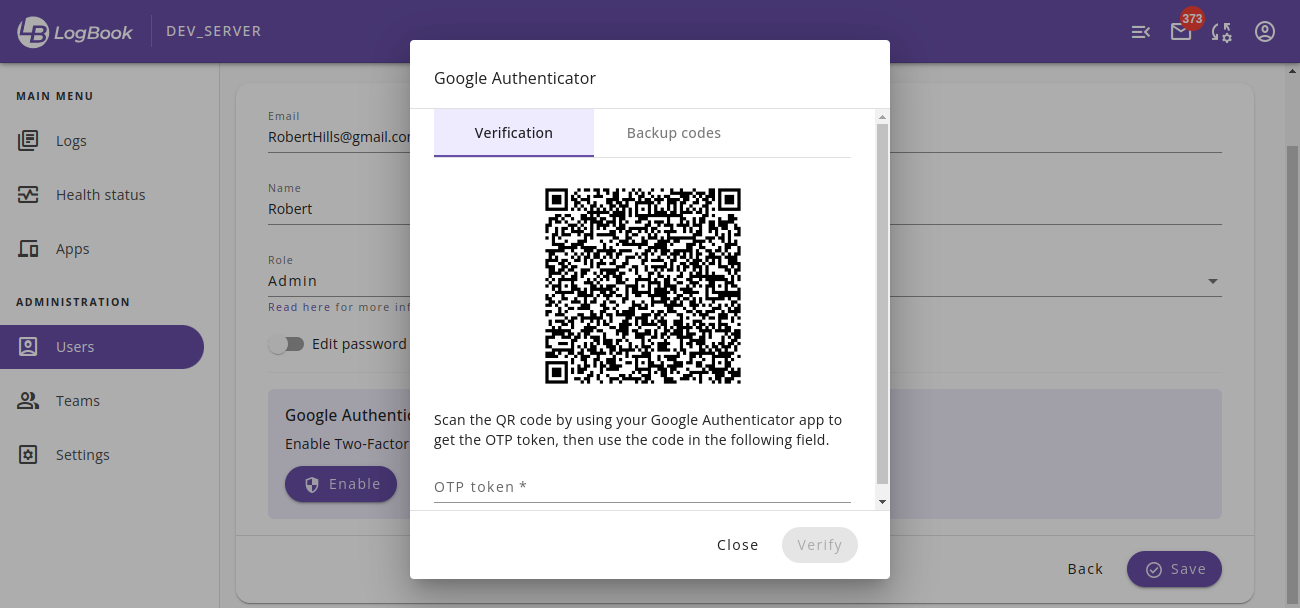
In addition to the global email-based 2FA authentication method, LogBook also provides Google Authenticator as another 2FA authentication option. Google Authenticator is a popular authenticator app that provides a more convenient way to implement two-factor authentication (2FA). It is considered more secure than using email as the secondary authentication factor because codes are generated on the user's device and not transmitted over network (internet). In LogBook, users can enable this feature from their own profile page (Image 5).
google_authenticator

Image 5. Enabling Google authenticator

III.2 Users Management

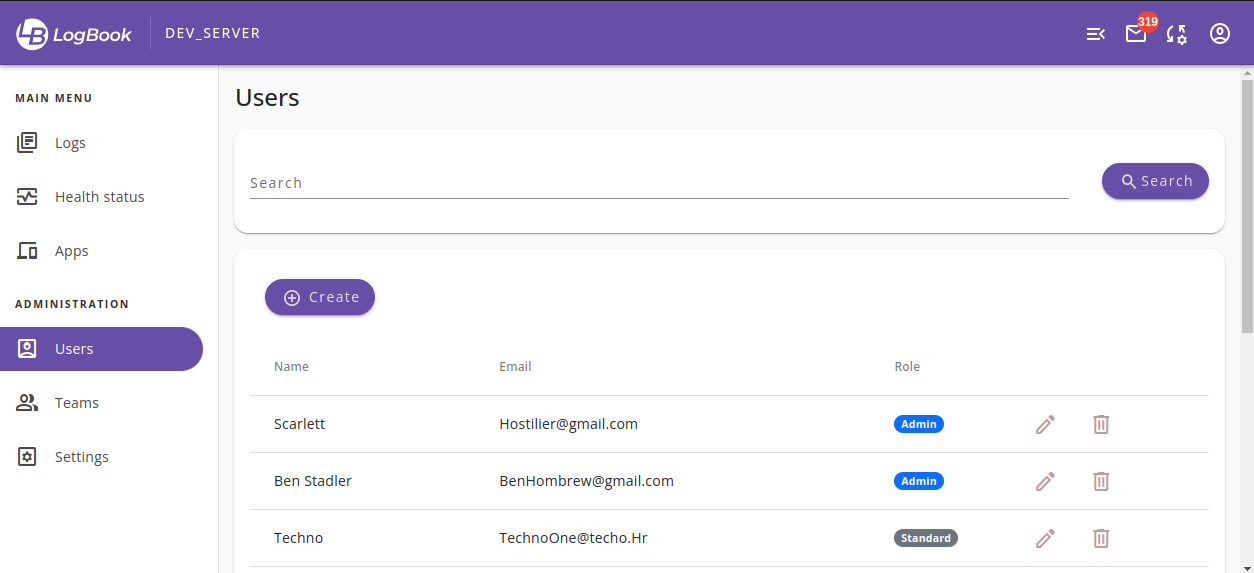
Users menu (Image 6) allows administrators to create, modify, and delete LogBook users.

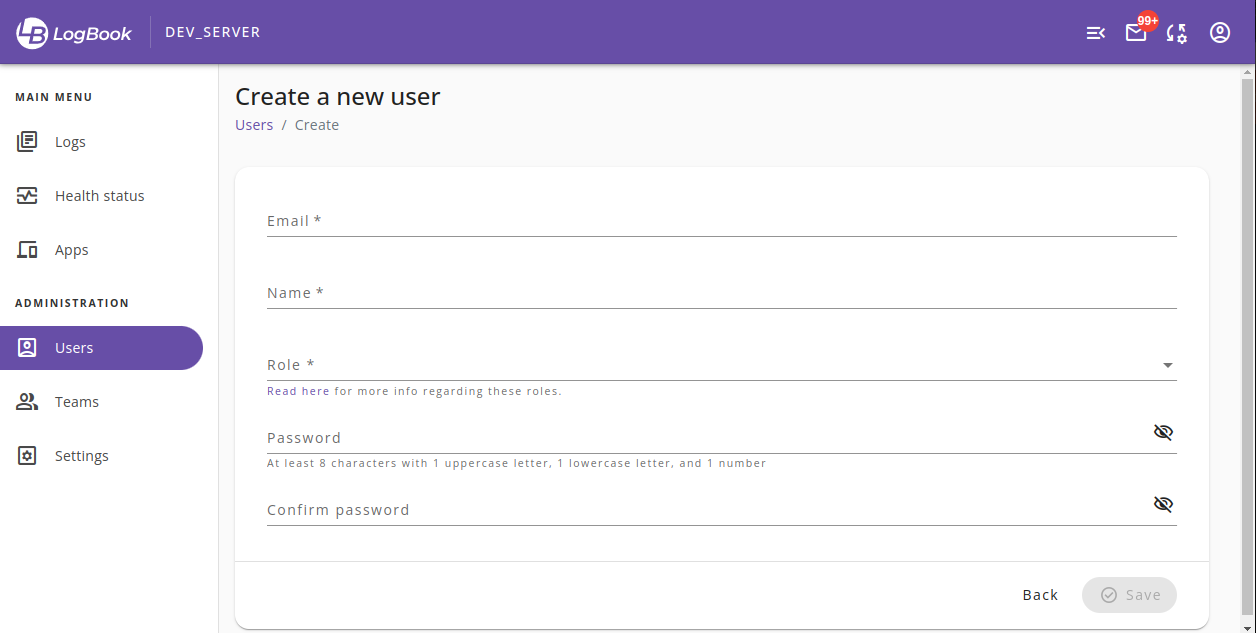
  1. User registration
    Allows administrators in creating new user accounts (Image 7).
  2. User roles
    Assign specific roles to users based on their responsibilities or access level.
  3. User deletion
    Allows administrators to delete any user account.
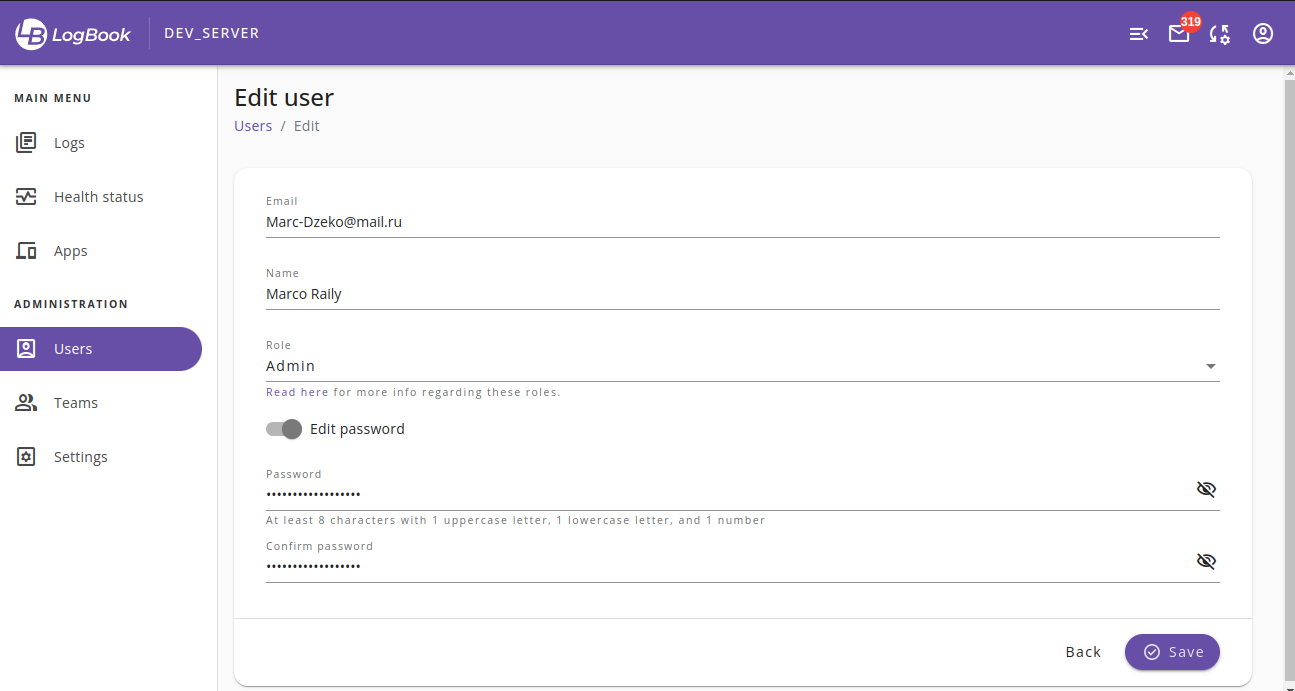
  4. Change user data
    Allows administrators to change any user data (Image 8).
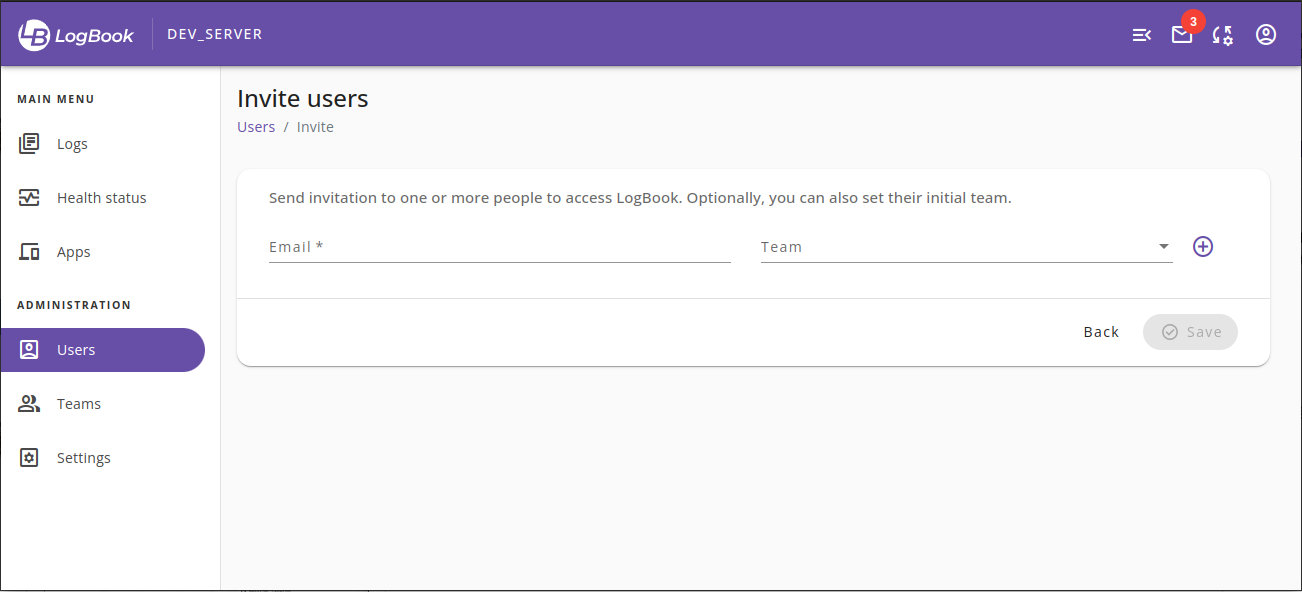
  5. Invite users
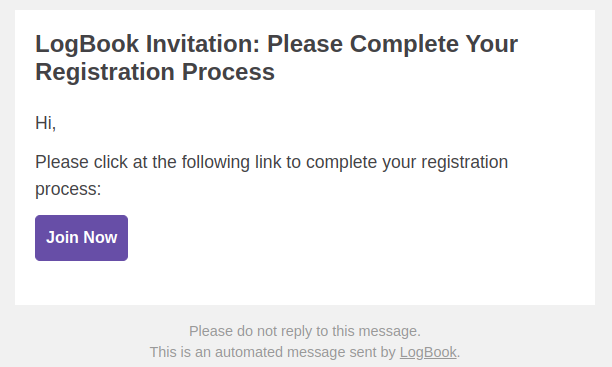
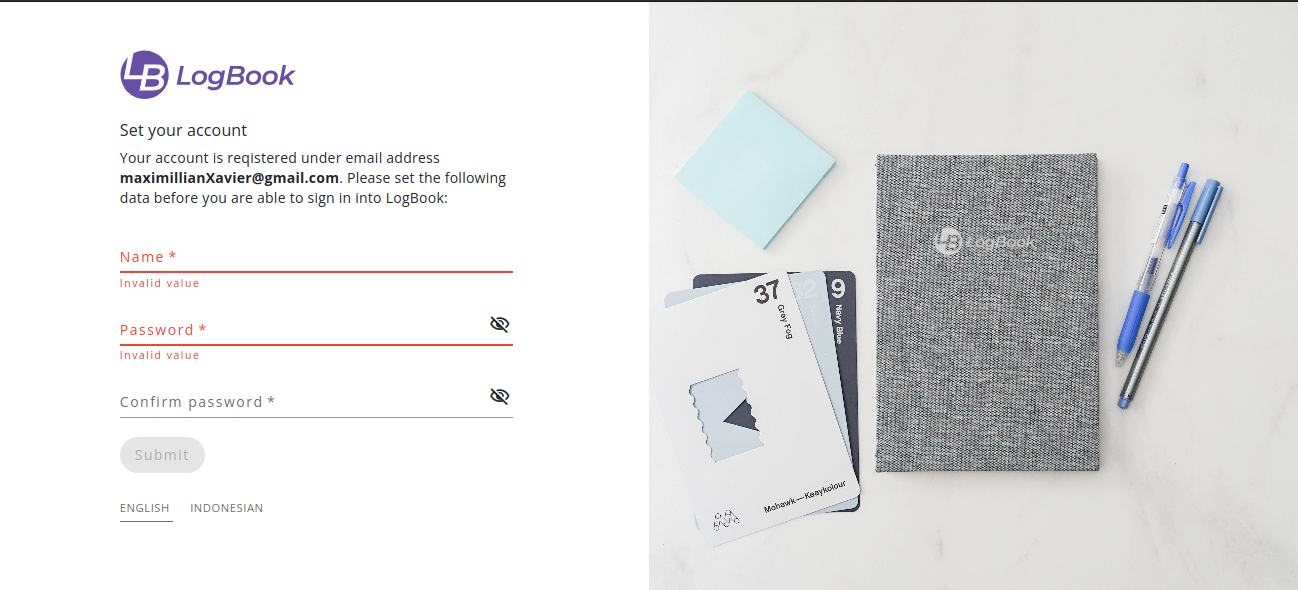
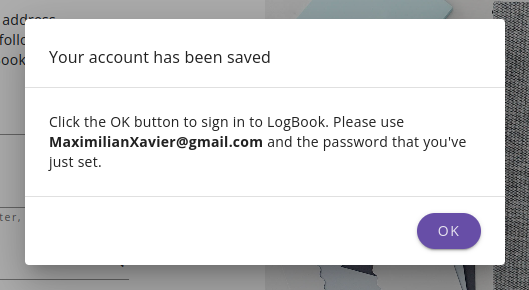
    Allows administrators to invite one or more people to access LogBook (Image 9). When the invited user clicks on their invitation link (Image 10), a "Set your account page" will be shown (Image 11). There will be a confirmation message (Image 12) when setup is completed, and the user should be able login with their email and password.
  6. Deactivating Google Authenticator
    Allows administrators to disable Google Authenticator for any user. This could be useful when a specific user can’t access their Google Authenticator app on their device (for example when the device is broken or stolen)

list-user

Image 6. List of users page

new-user

Image 7. New user registration page

edit-user

Image 8. User editing page

invite-users

Image 9. Invite user page

invitation-message

Image 10. Invitation message via email

setup-account

Image 11. Setup Your Account page

confirmation-account

Image 12. Account confirmation message

III.3 Teams Management

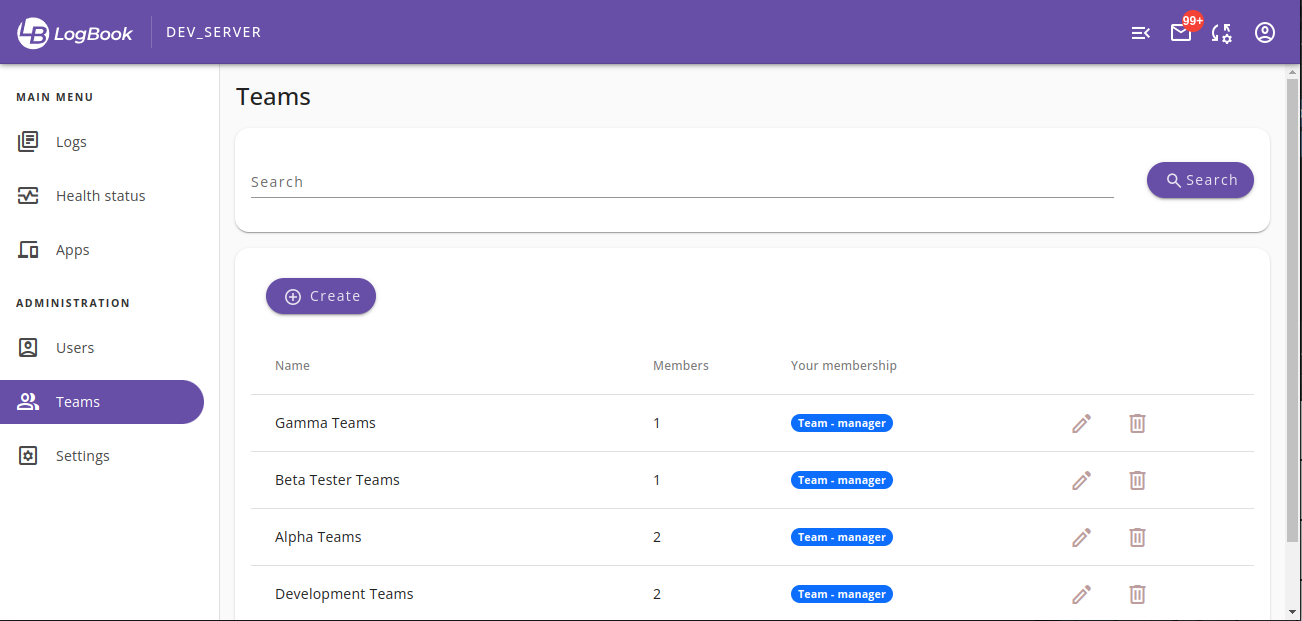
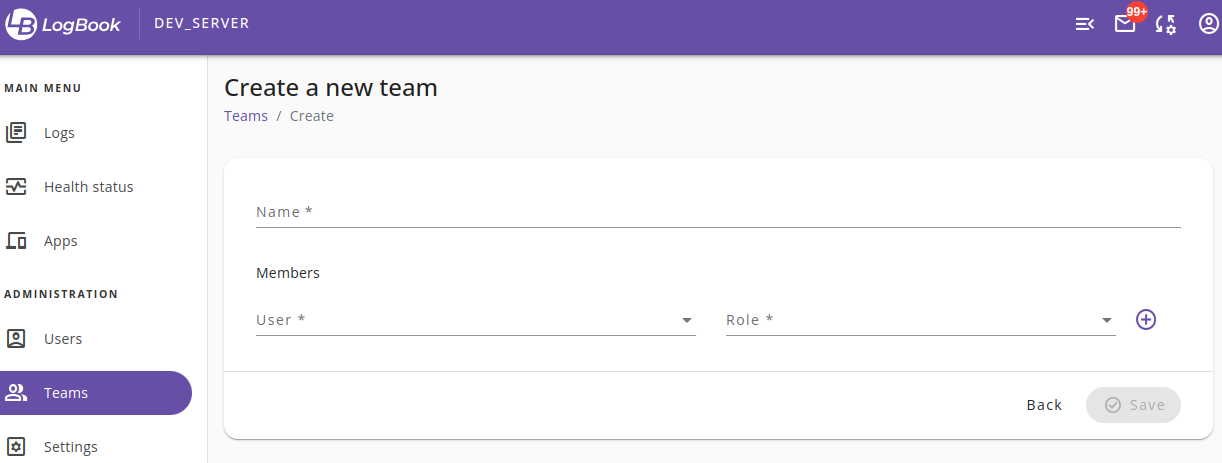
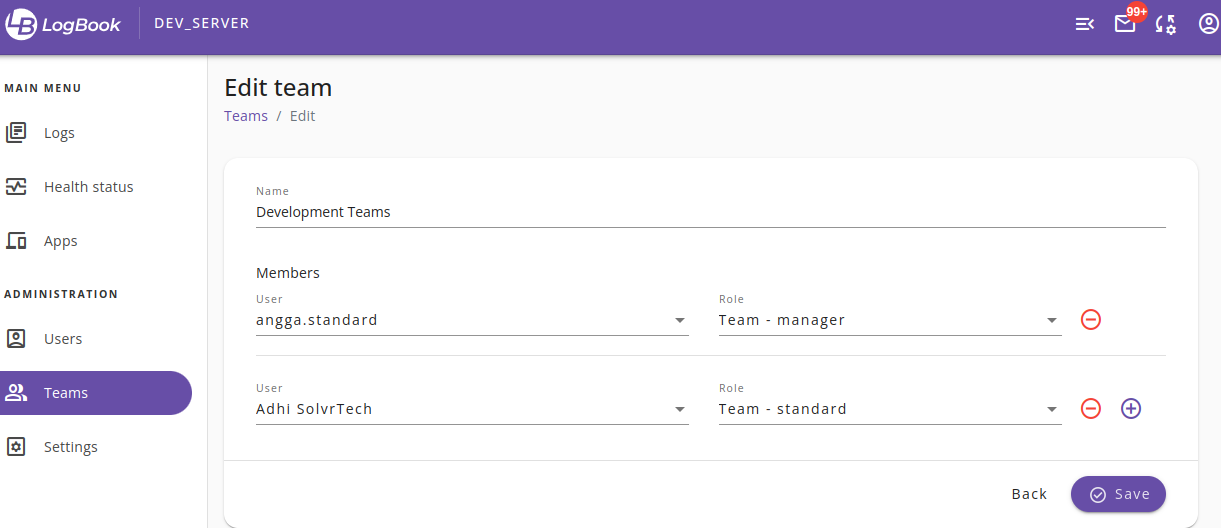
Teams menu (Image 13) allows administrators to manage teams and their members. It has the following features:

  1. Team creation
    Enables administrators to create a new team (Image 14).
  2. Registering team members
    Allows administrators to add, remove, or modify team members and assign their roles as Team-standard or Team-manager. These roles will have different access to and features for the assigned apps later on (Image 14 and 15).
  3. Team deletion
    Allows administrators to delete one or more team(s), as long as they are not assigned to any app yet.

list-teams

Image 13. List of teams page

new-team

Image 14. New team registration page

edit-team

Image 15. Team editing page

One exception is the My teams menu, which is visible only for Standard users (Image 16).

team-standard

Image 16. My teams page for standard users (non admin)

III.4 Apps Management

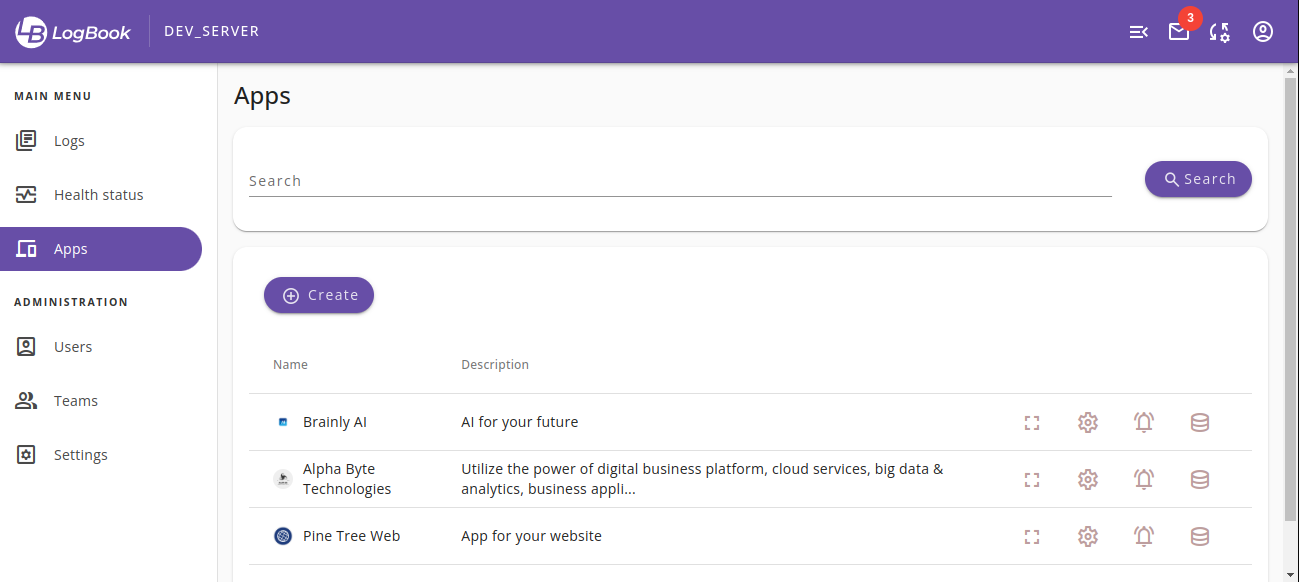
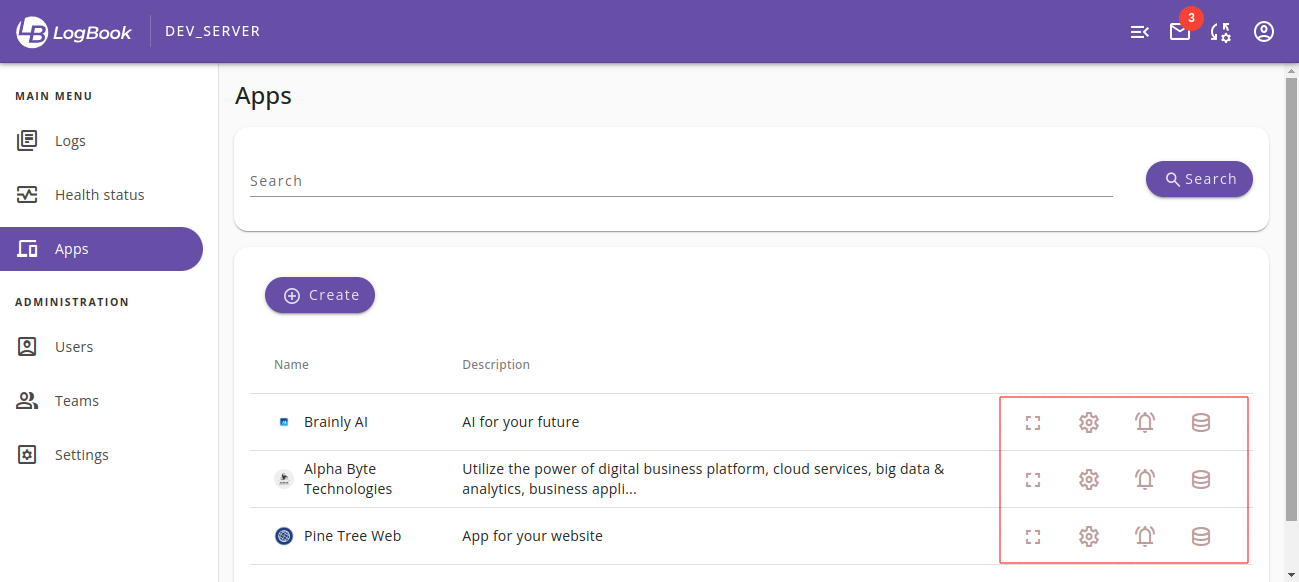
Apps menu (Image 17) allows administrators or authorized users to register apps that will be able to send their logs and health status data into LogBook. Please refer to this section(/logbook/docs/10/#iv-connecting-your-apps-to-log-book) in order to connect your apps to LogBook.

The Apps menu has the following core features:

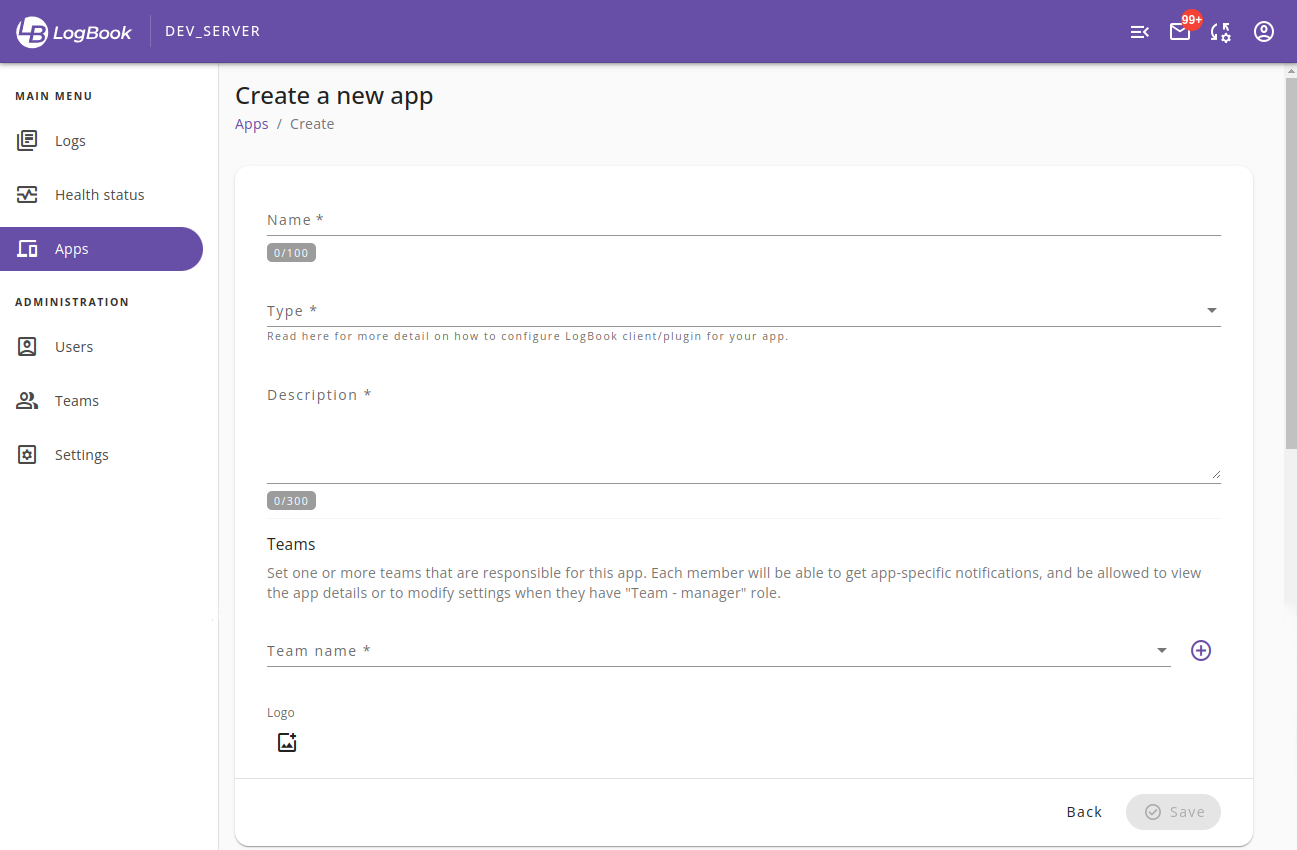
  1. App creation and teams access
    Enables administrators to create a new app and assign which team(s) that will have access into it (Image 18).
    • All team members (both team-standard and team-manager users) will be able to view app details and get notifications.
    • Only team-manager users will be able to view and modify app settings and alert configurations.
  2. Health status configuration
    Allows administrators and team-managers to specify the URL of their client app and the request period that LogBook will use to perform health checks to the client app. This feature ensures that LogBook can monitor the client app’s health status and trigger alerts as configured.
  3. Alerts configuration
    This feature would give administrators and team-manager users control over the types of alerts that will be sent and the frequency at which they will be sent to all team members.
  4. Email configuration (SMTP)
    Set configuration for SMTP connection that will be used to send outgoing messages when one or more conditions are matched as defined in the alerts config section.
  5. Logs
    View and filter submitted logs from the client app.
  6. Health status
    View and filter health check results for the client app.
  7. Backups
    Download the backup archives for the client app.
  8. Deletion
    Allows administrators to delete apps, removing all associated data including the submitted logs.

list-of-apps-page

Image 17. List of apps page

new-app-registration

Image 18. New app registration page

Once a new app data is saved, administrators will be able to:

  • view app’s overview, logs, and health status
  • modify app settings
  • manage alerts configurations

via the row menus (Image 19).

app-rows-menus

Image 19. Row menus in Apps page

Overview, Logs, and Health Status

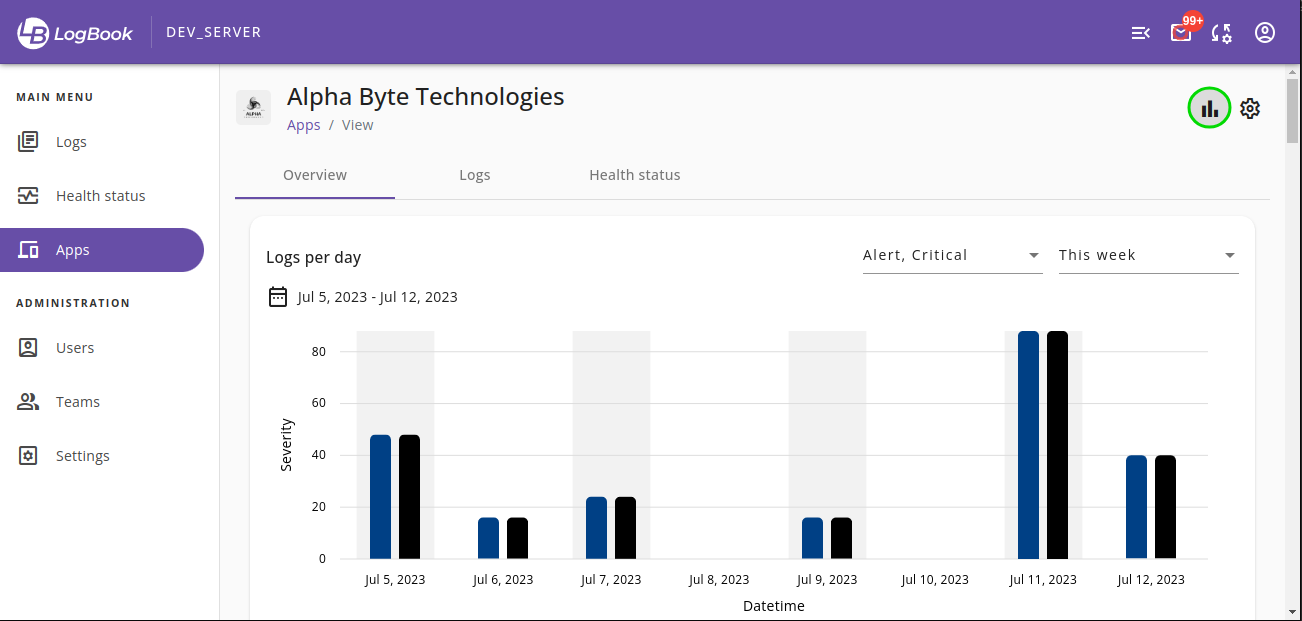
When granted users click on the view row menu item of any app (Image 19), a new page will be shown (Image 20). The first tab is Overview where users can view statistical graphs or widgets in several categories, such as health status in general, number of logs per day, health check results for caches, cpu load, database status, memory status, and so on. Users can also organize widgets by clicking the Organize graphs button (marked green on Image 20).

apps-overview-page

Image 20. Apps overview page

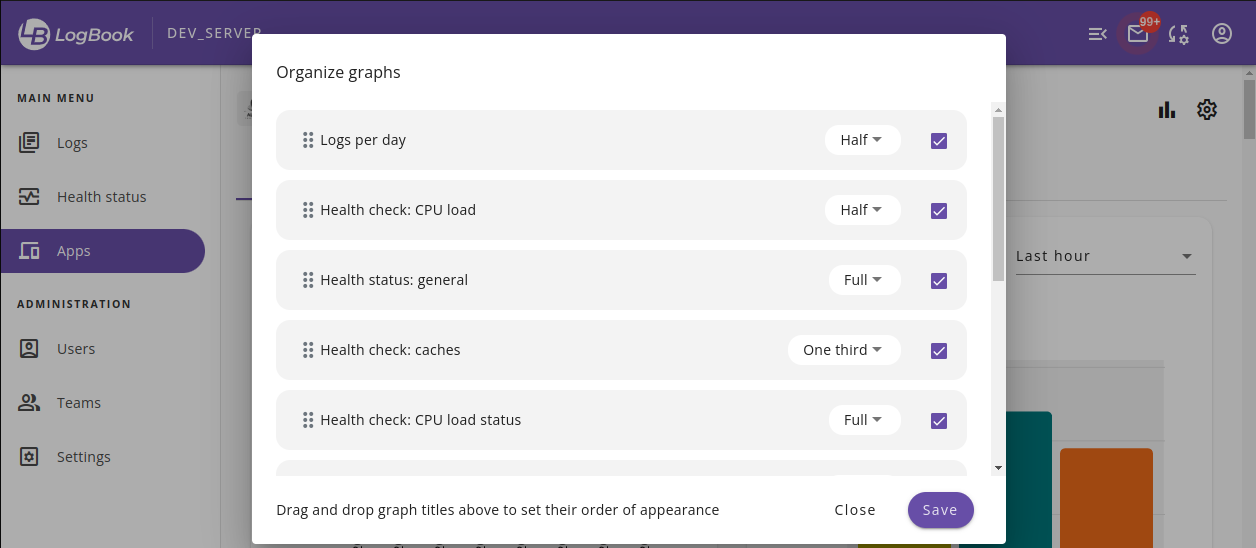
Users can change each graph or widget's size, visibility, and their visual order of appearance in the Organize graphs dialog (Image 21).

organize-widgets-or-graph

Image 21. Organize widgets or graphs dialog

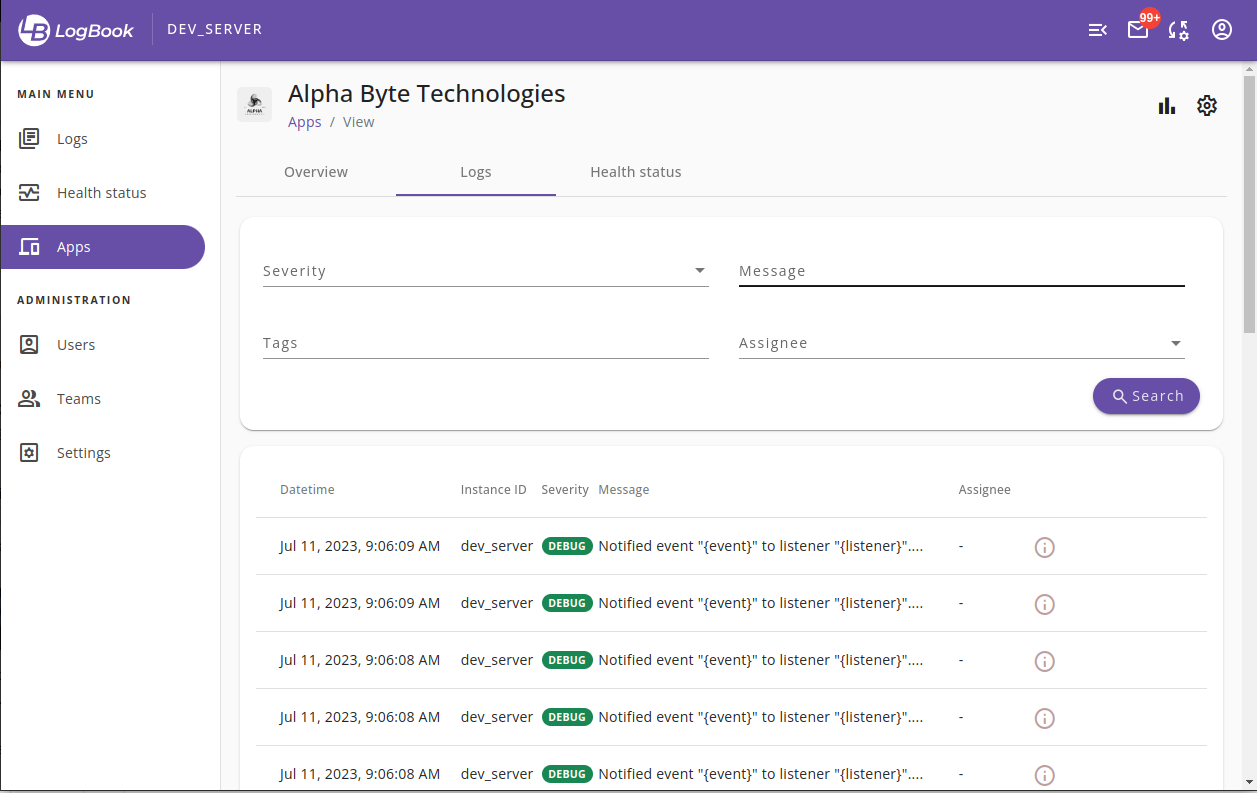
The second tab is Logs which is similar to the main Logs page, except it is showing only submitted logs data of the currently selected app (Image 22).

logs-selected-apps

Image 22. List of submitted logs on a selected app

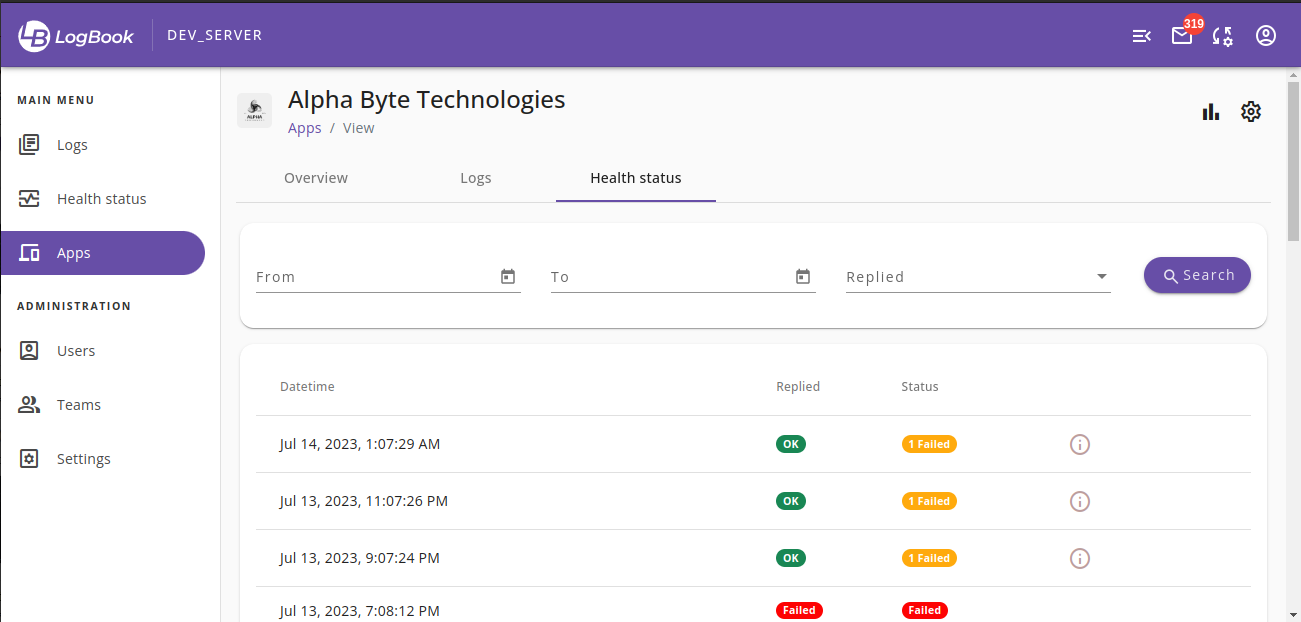
The last tab is Health status, which is similar to the main Health status page, except it is showing only health check results of the currently selected app (Image 23).

list-of-health-checks

Image 23. List of health checks result on a specific app

App Settings

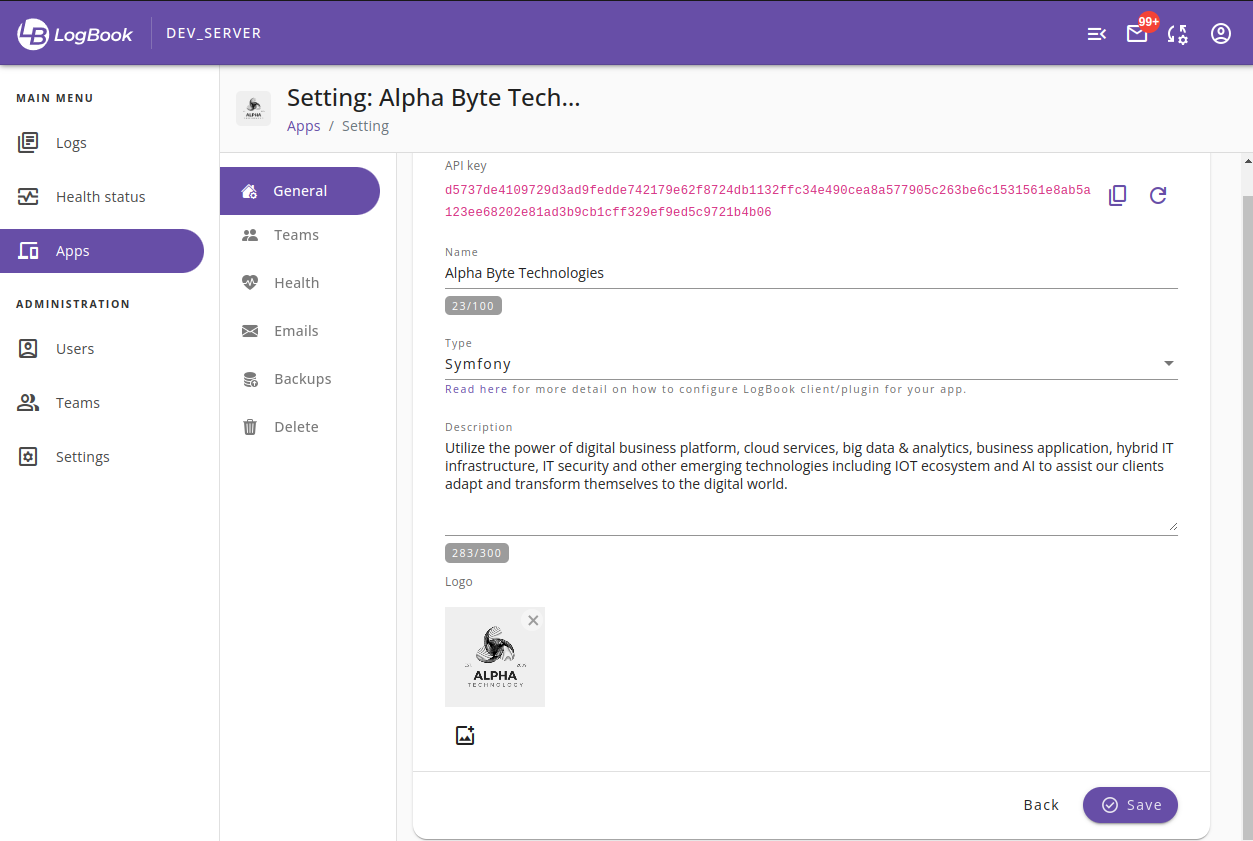
When granted users click on the setting row menu of any app (Image 19), the settings page will be shown (Image 24). Here, users should be able to do the following: Modify general app settings, including regenerating API key and provide app info.

  • Register teams that should have access to the app
  • Enable or disable health checks action for the registered app, along with its configuration
  • SMTP configuration for sending outgoing emails
  • Delete app and related data permanently

setting-page-one-selected-app

Image 24. Settings page on a selected app

Alerts Configuration

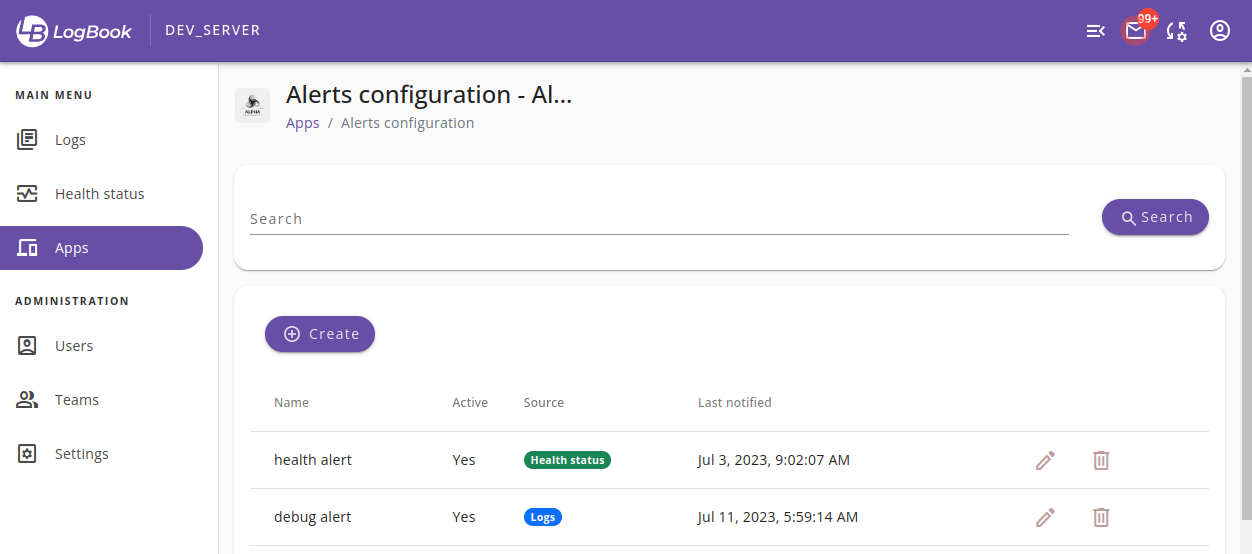
Alerts configuration page will be shown (Image 25) when granted users click on the alerts configuration row menu item in Apps page (Image 19). Here, users can specify the triggering conditions for when team members of the selected app should be notified. Alerts configuration can be divided into two kind of sources:

  • Logs
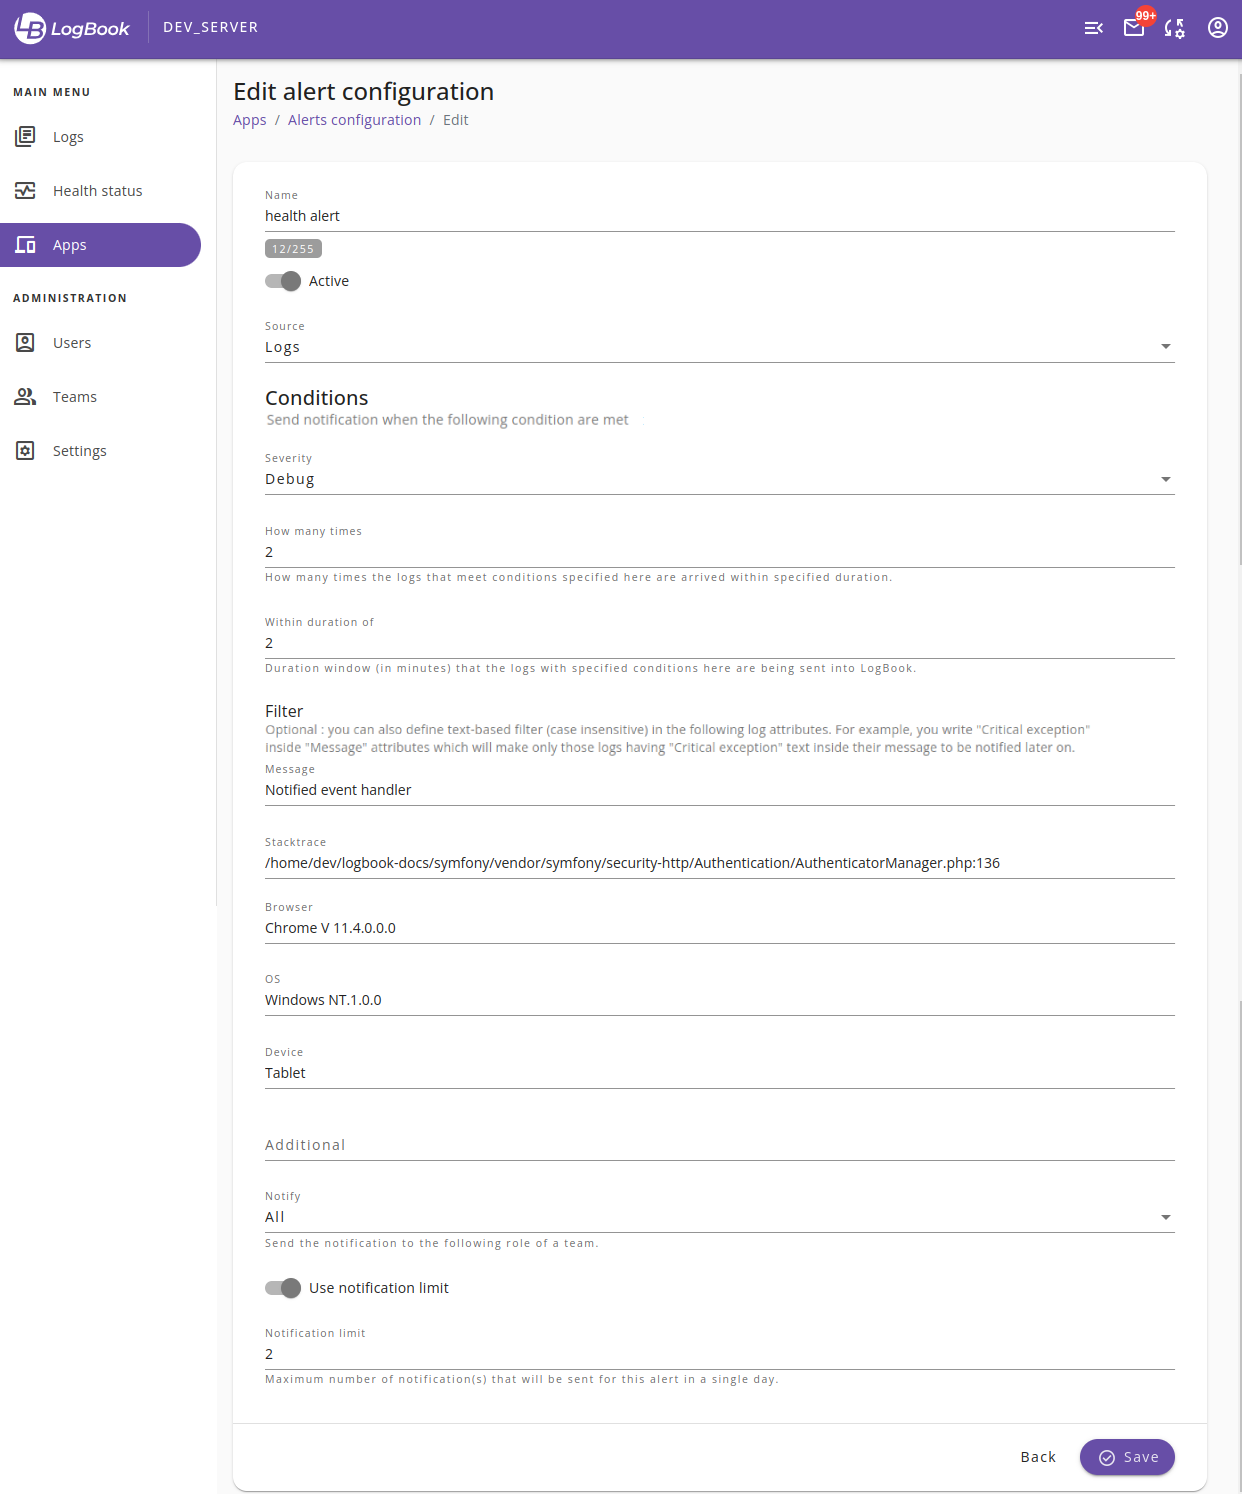
    Alerts should be triggered when log arrives, and one or more specified conditions are matched as seen in (Image 26).
  • Health status
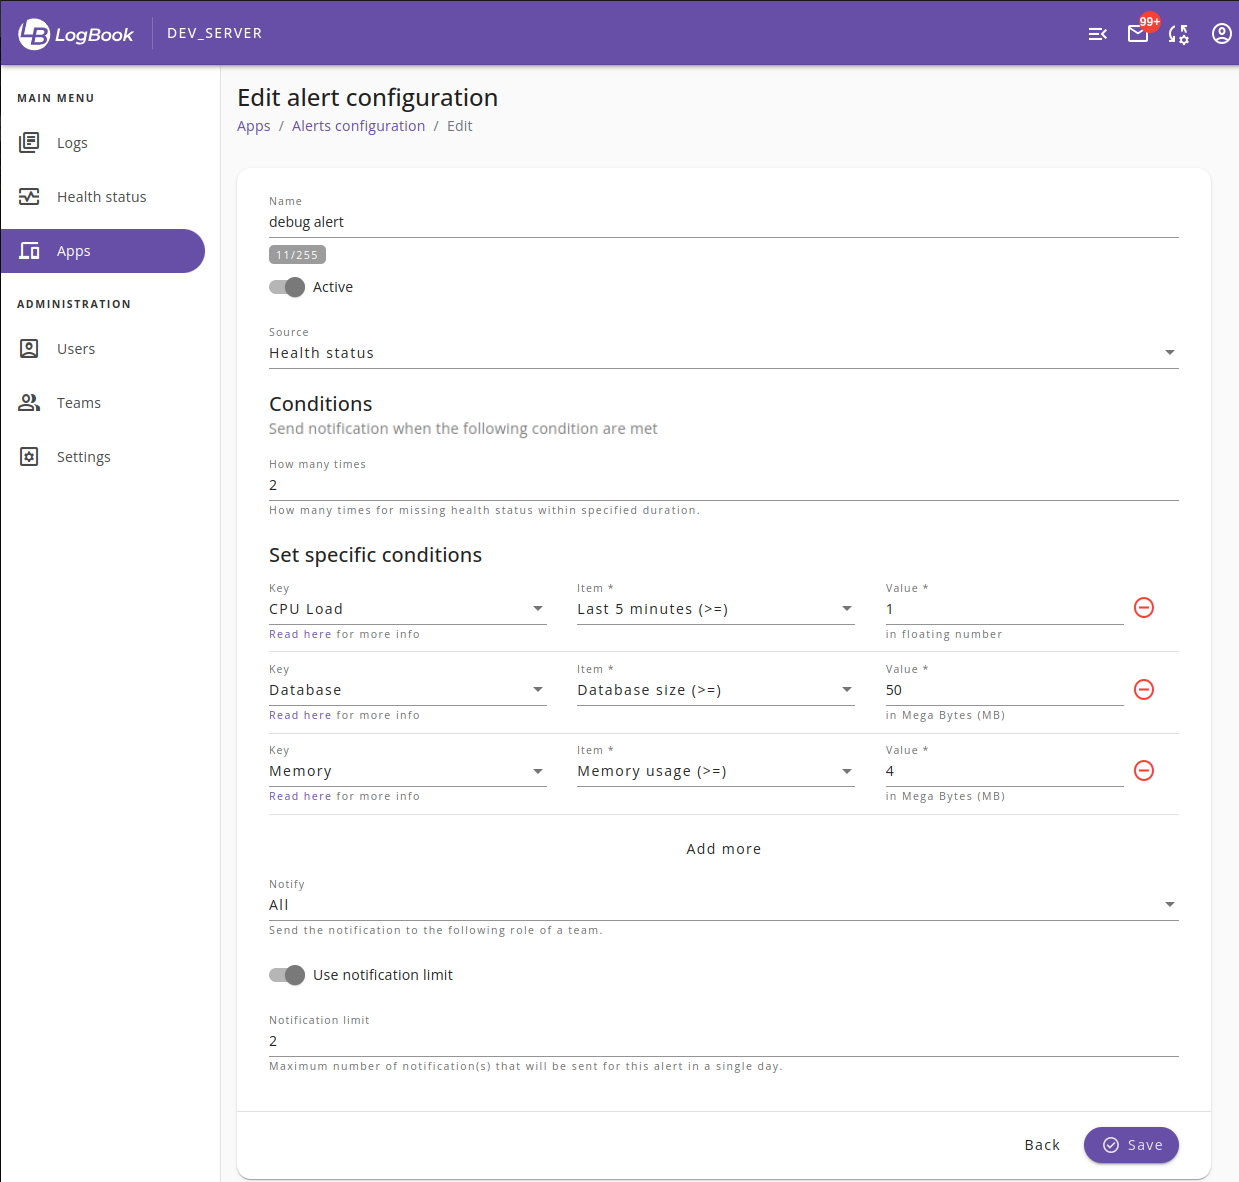
    Alerts should be triggered when LogBook sends an HTTP health check request and receive one or more specified conditions (Image 27).

alerts-configuration

Image 25. Alerts configuration page on a selected app

alerts-configuration-with-logs

Image 26. Example of an alert configuration with source = logs

alerts-configuration-with-source-health

Image 27. Example of an alert configuration with source = health status

Backups

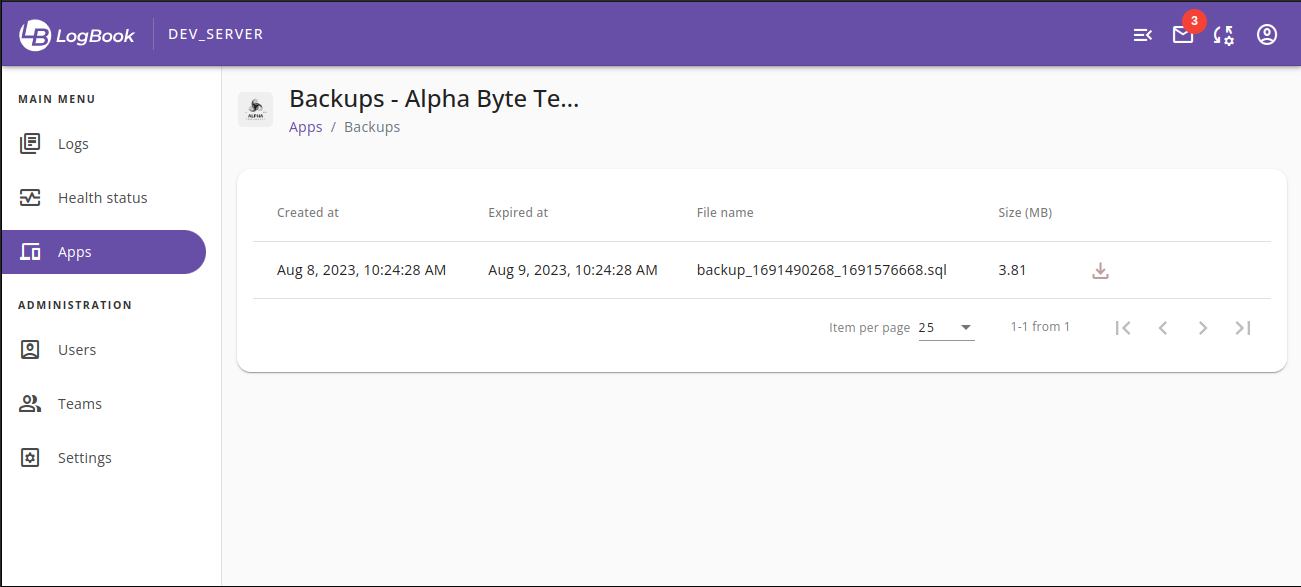
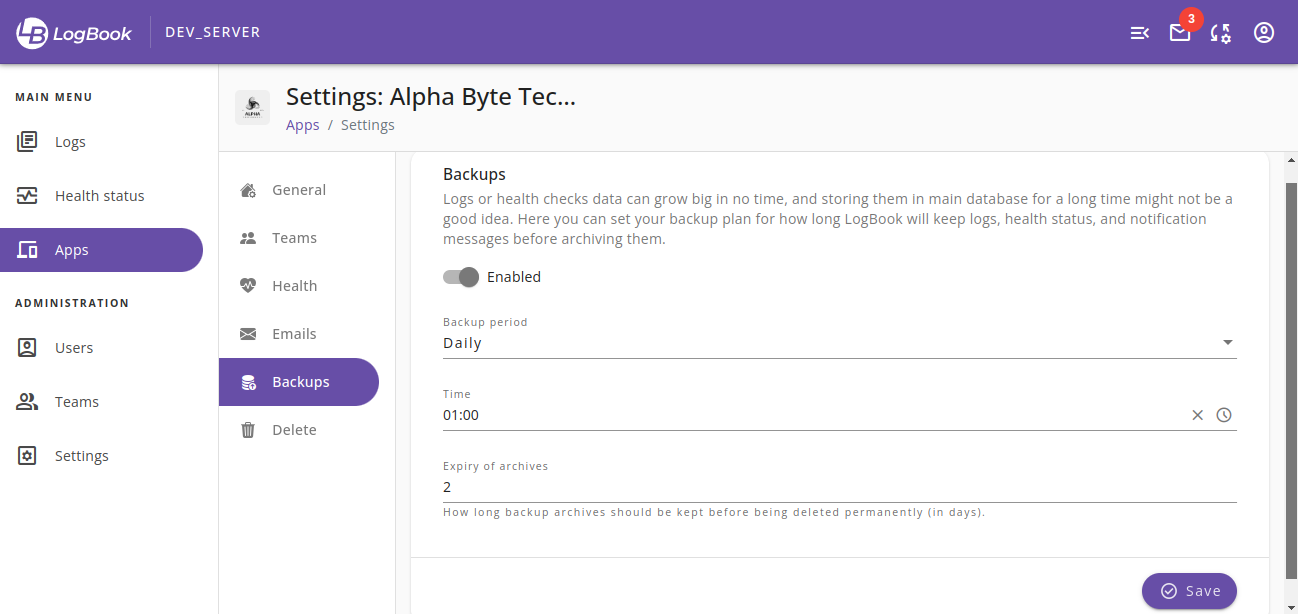
Backups page will be shown (Image 28) when the granted user clicks on the “Backups” row menu item in the Apps page (Image 19). This backup feature will be available only when the admin or team-manager enabled the backup plan on the app settings (image 29).

backups

Image 28. Backups page

apps-backups

Image 29. App’s backups setting

III.5 Logs

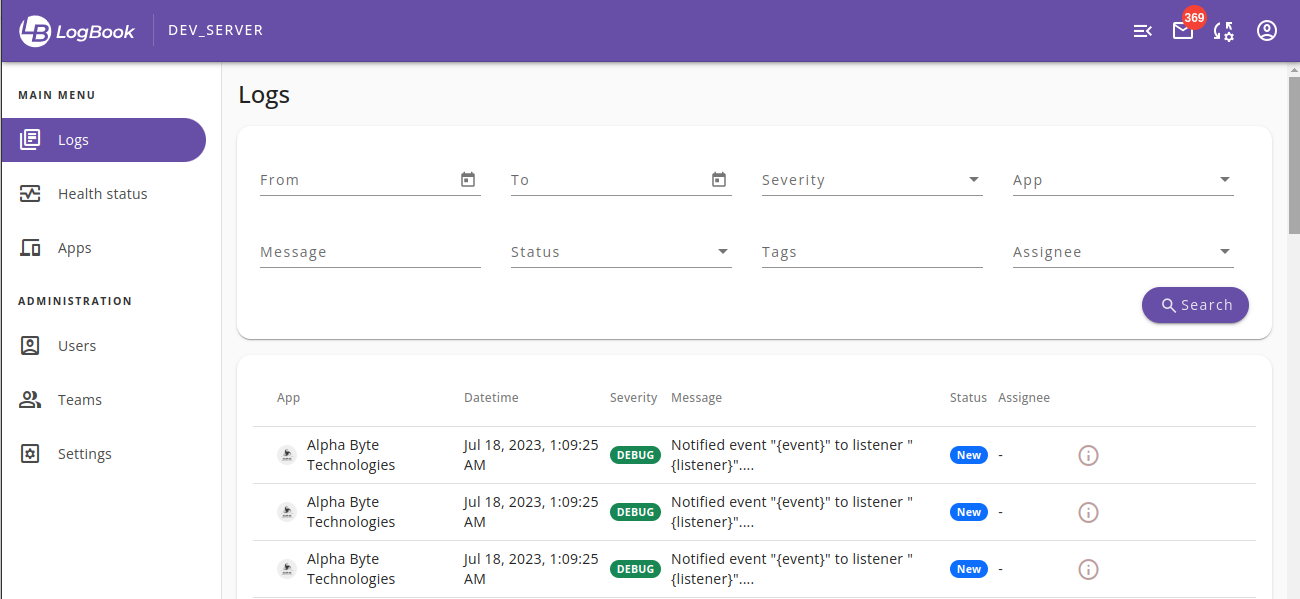
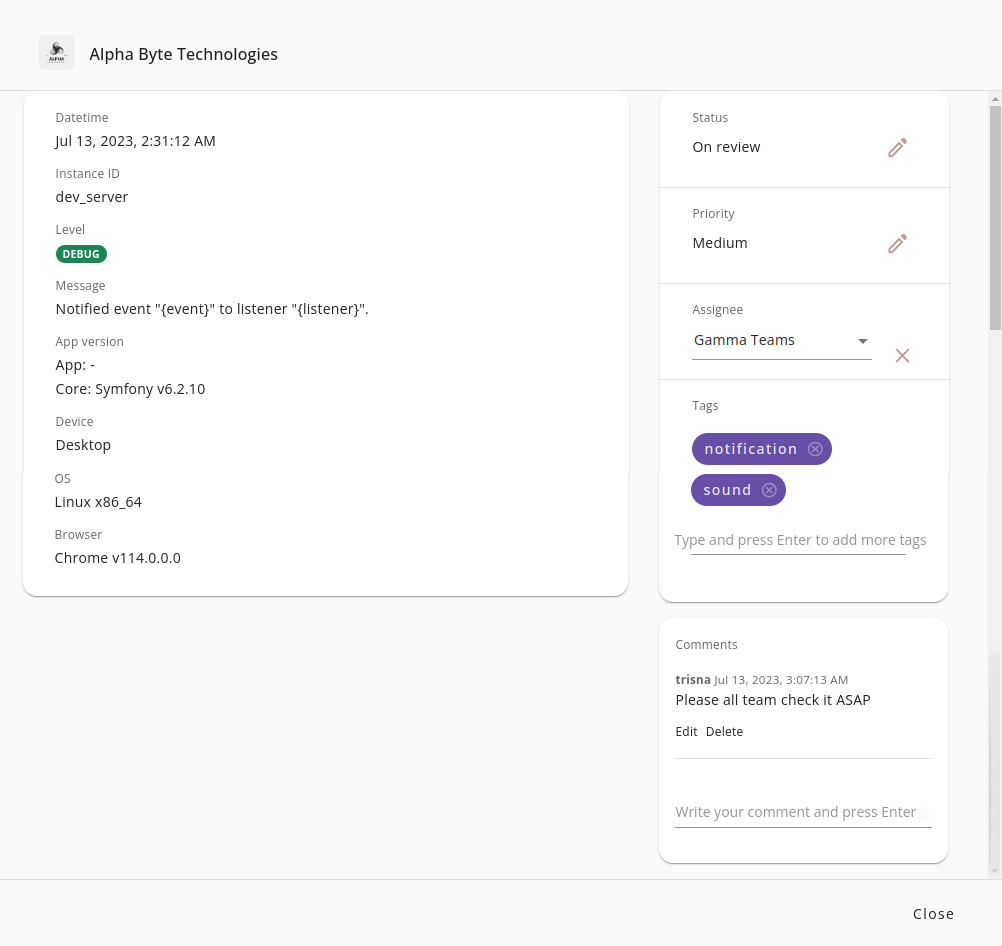
The main logs page (Image 30) allows users to view and filter all submitted logs from the registered apps, which their team(s) are given access into. Granted users are also able to work on a specific log by submitting comments and assigning the responsible person for the issue (Image 31).

The key features are:

  1. All team members are able to access the logs page, where they can view logs from one or more apps and filter them based on various criterias such as submitted date, tags, log severity, message content, and so on.
  2. All team members can submit comments in the log details section in order to provide context and additional information.
  3. Only users with the team-manager role can set the assignee for logs. This can help to ensure that issues are tracked and being addressed promptly.

logs

Image 30. List of all client app logs page

detail_log

Image 31. Detail log page

III.6 Health Status

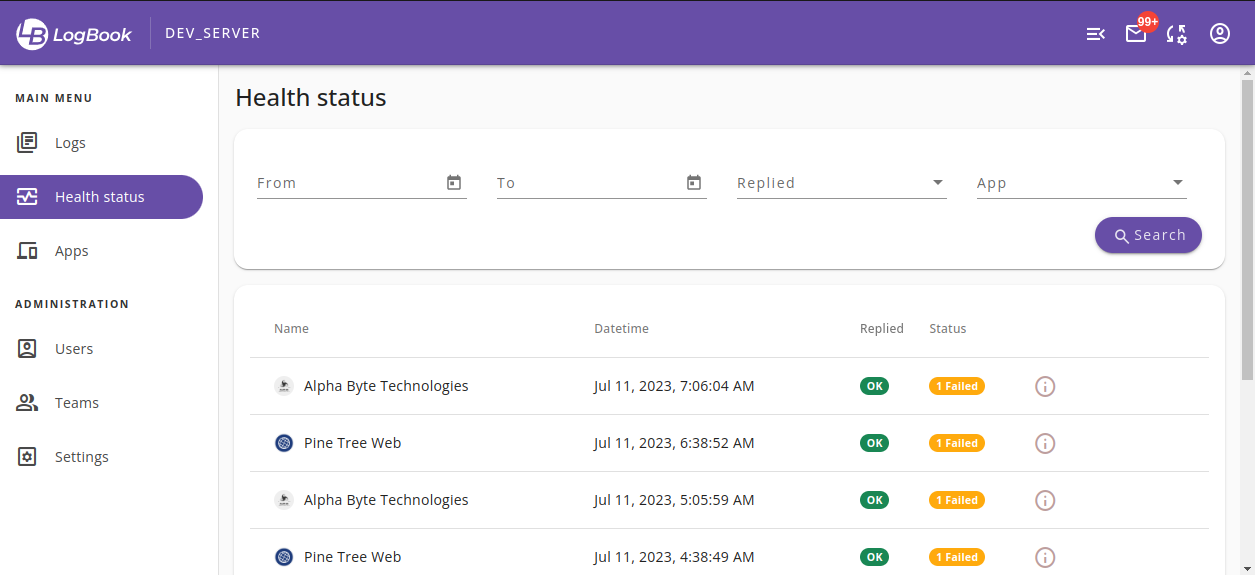
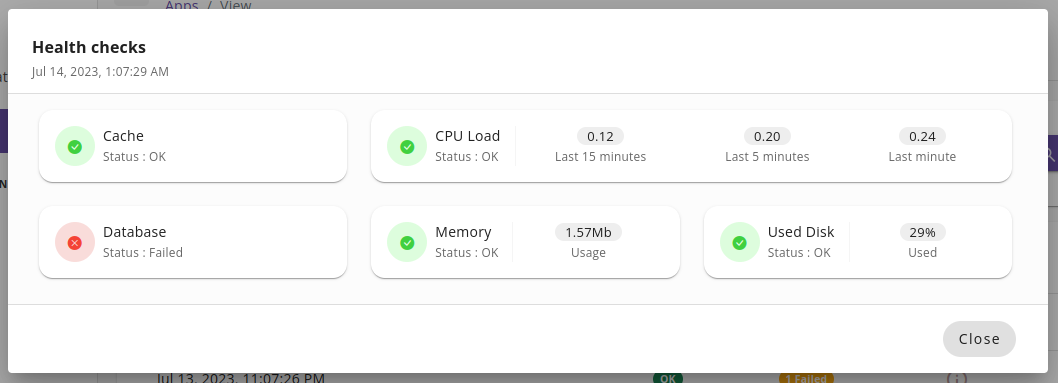
The main health status page (Image 32) shows aggregated health check results from all granted apps for the current logged in user. Users can filter data by submitted date, from which app, and if the app replied LogBook health check request successfully or not. Clicking the info button will show the more detailed info about the health check of the selected row, as seen in (Image 33).

LogBook perform the following health checks:

  • Cache: check whether the cache on your application is working properly.
  • CPU load: monitors the Unix CPU load number of the client app’s server. By default, three numbers are given:
    • load in the last minute
    • load in the last 5 minutes
    • load in the last 15 minutes
  • Database: Check whether your application's database is accessible while also checking the storage size being used in MB.
  • Memory: Check the amount of memory being used by your application in MB.
  • Used Disk: Check the amount of used disk space in percentage.

heatlh_status

Image 32. Health status page

health_detail

Image 33. Health check details

III.7 Notifications

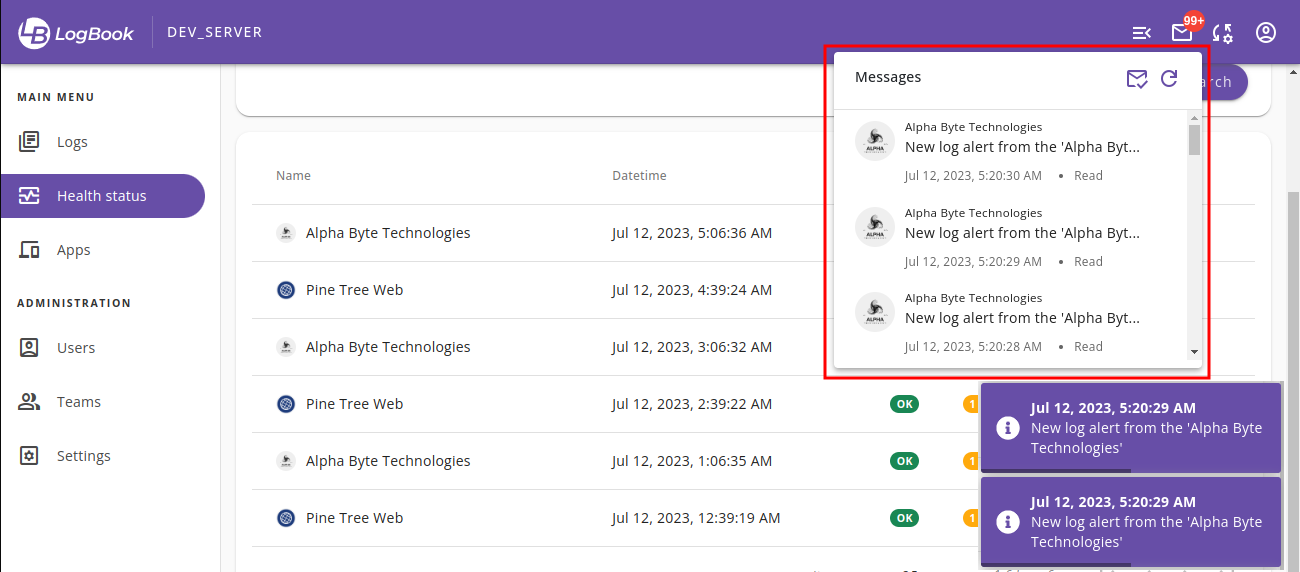
When the SMTP configuration is configured correctly, LogBook will be able to send outgoing email messages to the app’s team members when specific incoming logs or health check conditions match one or more alert configurations. Each outgoing message is noticeable and accessible within the Messages part in LogBook (Image 34). The messages button in the top-right part of the header should also show the number of unread messages.

These in-app messages data are populated in two possible ways:

The first one is when Mercure is not used on the backend side so automatic (and periodic) data fetching for messages feature will be used in the frontend side. Users will then be able to configure the auto refresh setting for messages. More about this in section III.8.

The second one is when Mercure is being used on the backend side, where it will be able to push messages instantly from backend to the frontend side. An alert popup will be shown on the bottom-right when a new message arrives (Image 34 and 35).

message_panel

Image 34. Messages panel

floating_message

Image 35. Notification popup

Troubleshoot: No Sound on Incoming Messages
LogBook should play a notification sound when a new message arrives. But when your browser is not allowing that by default, you need to allow 'Notifications' and additional 'Sounds' configuration for your LogBook site.

Read Here for more info on how to fix it in different browsers.

III.8 Auto refresh

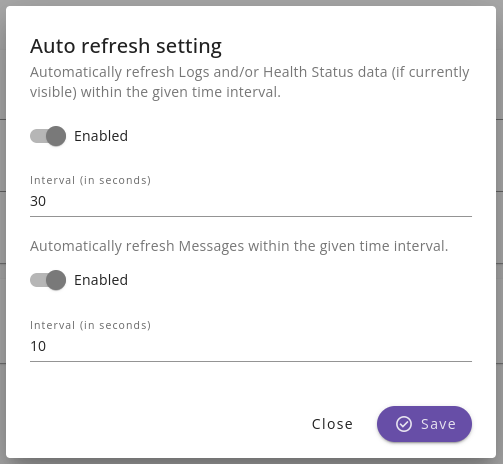
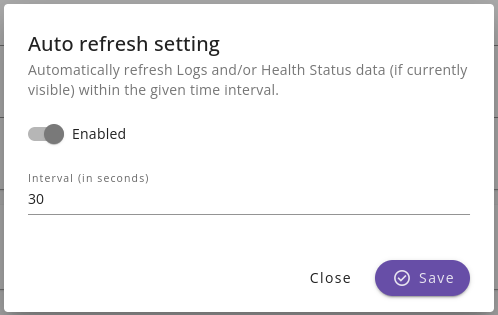
Users can click on the auto refresh setting button on the main header to show the auto refresh setting dialog (Image 36). Users can enable or disable periodic data fetching for logs, health status data, and messages within the given time interval.

It uses the following conditions:

  • Periodic data fetching for logs and health status will occur only when auto refresh setting is enabled and the user is currently viewing UI components for logs or health status.
  • Auto refresh config for messages will not be available when the LogBook backend is set to use Mercure for in-app notifications (Image 37). Because when Mercure is being used and configured properly, the backend side will push notifications to the frontend side instead.

auto_refresh_without_mercure

Image 36. Auto refresh setting when backend is not using Mercure

auto_refresh_with_mercure

Image 37. Auto refresh setting when backend is using Mercure

III.9 Global Settings

LogBook provides global settings to configure general application behavior, separated into the following sections.

General
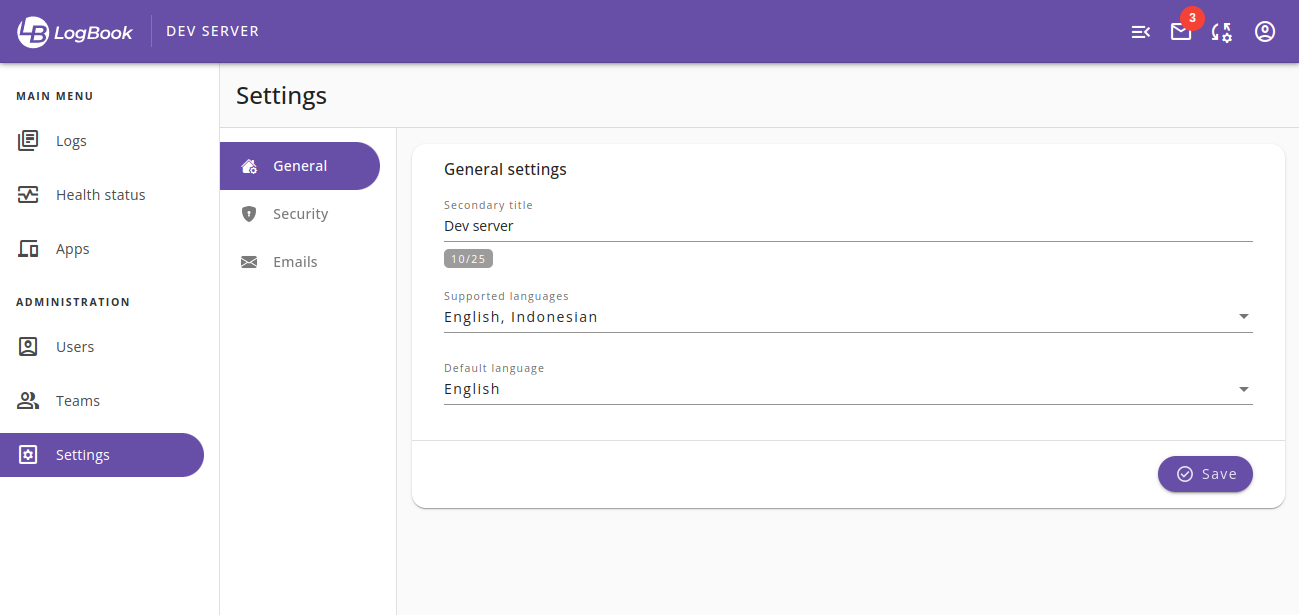
As seen in Image 38, administrators can set active and supported language(s), as well as application secondary titles that will be shown in the application logo section.

global_setting_general

Image 38. Global Settings - General

Security
Here administrators can set authentication rules such as signing in behaviors and enabling/disabling email-based two-factor authentication (Image 39). When email-based 2FA setting is enabled, all users will have to follow unless they enabled a personal 2FA method from their own profile page (Google Authenticator).

global_setting_securtiy

Image 39. Global Settings - Security

Email
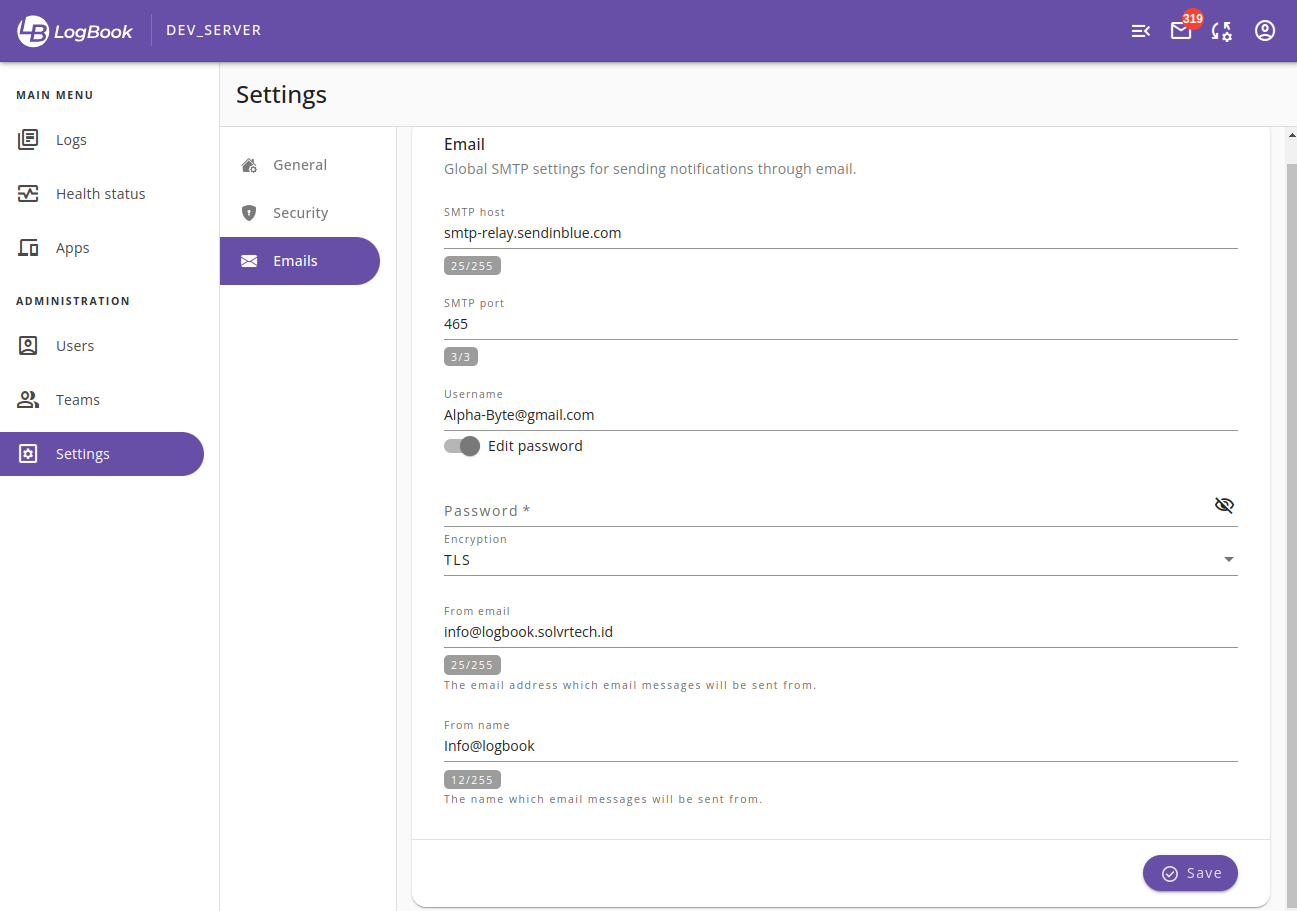
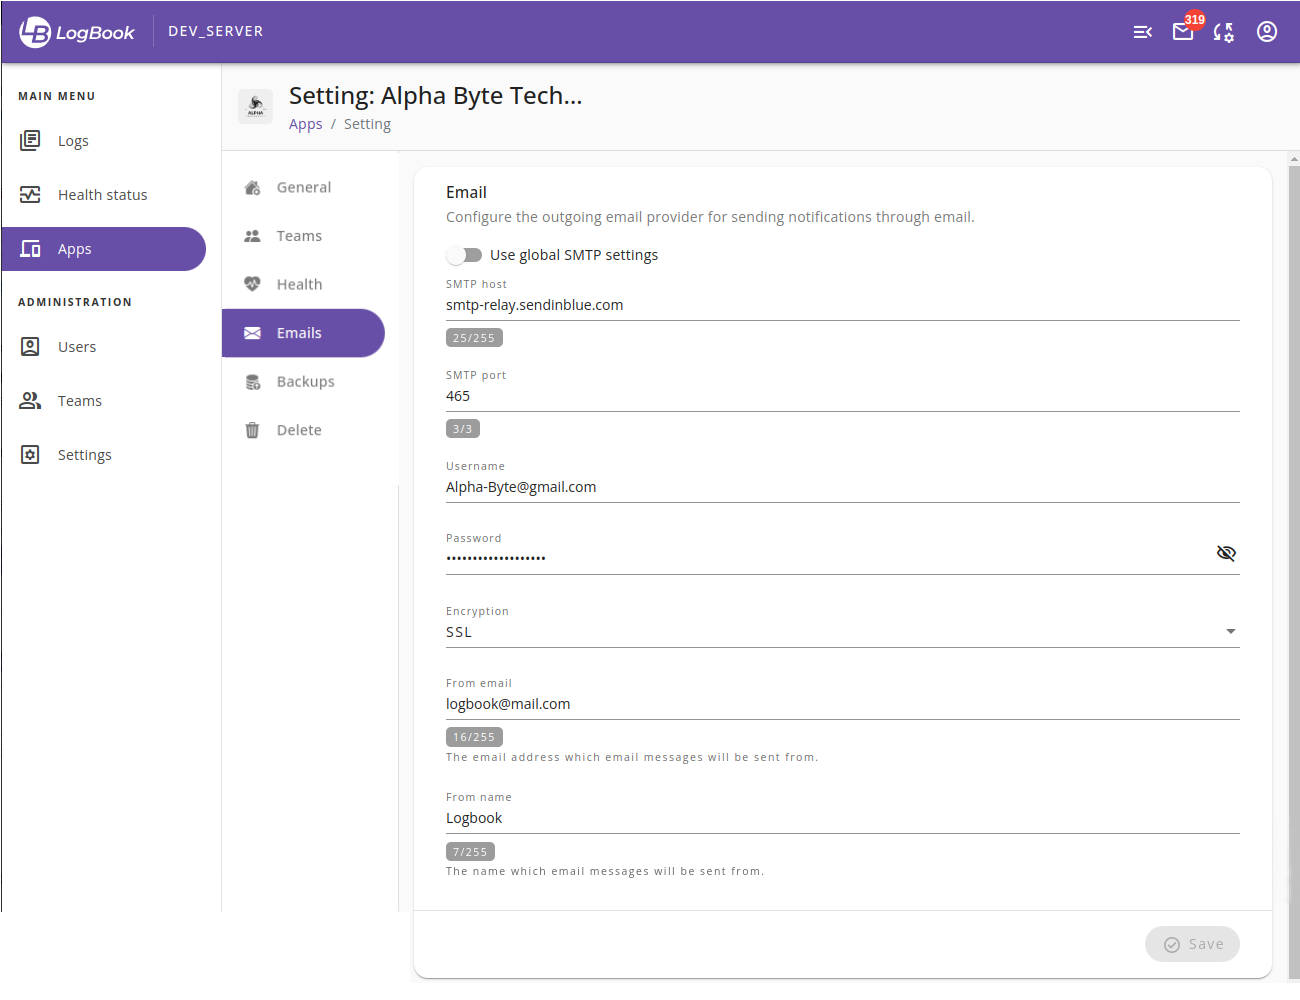
Administrators can set global SMTP settings for LogBook to send notifications (Image 40). The global SMTP settings can also be used by apps through their own app settings (Image 41).

global_setting_email

Image 40. Global Settings - Emails

global_smtp

Image 41. App is using global SMTP settings for sending their notifications

IV. Connecting Your Apps to LogBook

LogBook currently supports apps that are built using the following frameworks:

  • Laravel (v8.0 or greater)
  • Symfony (v5.0 or greater)

In order to be able to submit logs and perform health checks, you have to do the following:

In LogBook:

  1. A respective app data must be created and configured first in LogBook. This can be done in the Apps menu. An API key will be generated there where you can use it later in your application config.
  2. Enable health check option in the LogBook app settings. You will have to provide your application’s URL and the time period for sending health checks request to your application.

In your application:

  1. Install LogBook client package in your application.
  2. Set your LogBook installation URL and the API key in your application config.

IV.1 Installing Client Package in Laravel Apps

laravel-logbook extends Laravel's logging functionality by adding additional capabilities to send the log messages to the targeted LogBook installation. You can install the package by running the following command in the root folder of your Laravel app:

composer require solvrtech/laravel-logbook

Publish the config/logging.php config file as follows:

php artisan vendor:publish --tag=logbook --force

then check your app configuration. Make sure that the channels stack in the config/logging.php file contains logbook as follows:

// config/logging.php

// ...
'channels' => [
    // ...

    'logbook' => [
        'driver' => 'logbook',
        'level' => env('LOG_LEVEL', 'debug')
    ],
]

Laravel-logbook has 3 configuration variables that you must use in the .env file. For example in the following snippet:

# .env

LOG_CHANNEL=logbook
LOG_LEVEL=debug
LOGBOOK_API_URL="https://logbook.com"
LOGBOOK_API_KEY="4eaa39a6ff57c4..."

# Instance ID is a unique identifier per instance of your apps
LOGBOOK_INSTANCE_ID="default_server"
  • LOGBOOK_API_URL

    The actual URL of your LogBook installation

  • LOGBOOK_API_KEY

    The API key that LogBook had generated for the app

  • LOG_LEVEL

    Specify the minimum log level that will be submitted to your LogBook installation. The ordered log levels are (from low to high):

    1. DEBUG

    2. INFO

    3. NOTICE

    4. WARNING

    5. ERROR

    6. CRITICAL

    7. ALERT

    8. EMERGENCY

    For example, if you set LOG_LEVEL=WARNING, then only higher log levels such as WARNING, ERROR, CRITICAL, ALERT, and EMERGENCY are going to be submitted to your LogBook installation.

Submitting logs into LogBook
To submit log messages, use the Laravel Log facade in your controller or service class:

use Illuminate\Support\Facades\Log;

class UserController extends Controller
{
    public function show($message)
    {
        Log::emergency($message);
        Log::alert($message);
        Log::critical($message);
        Log::error($message);
        Log::warning($message);
        Log::notice($message);
        Log::info($message);
        Log::debug($message);

         // ...
     }
}

More info about Laravel logging can be found in their documentation page.

Your application version
Application version is one of the parameters that laravel-logbook will send to your LogBook installation. In your Laravel application, add the version on /config/app.php file:

// config/app.php

return [
    // ...

    'version' => "1.0.0"
];

It's worth noting that while it's recommended to set the application version parameter in your Laravel app's configuration, it is not a required step to use laravel-logbook. If the parameter is not set, laravel-logbook will still function normally, but the version information will not be available in the logs.

IV.2 Installing Client Bundle in Symfony Apps

symfony-logbook is a bundle that allows you to collect logs generated by your Symfony application and submit them into LogBook. This bundle provides seamless integration with monolog-bundle and allows you to create and store log messages in a variety of different places while triggering various actions.

To install symfony-logbook, use the composer package manager by executing the following command in your terminal:

composer require solvrtech/symfony-logbook

After the installation, register the symfony-logbook bundle in your application's config/bundles.php file by adding the following code:

// config/bundles.php

return [
    //  ...
    Solvrtech\Symfony\Logbook\LogbookBundle::class => ['all' => true],
];

In case you did not execute the recipe during the composer require command, you will need to manually create a new logbook configuration file at /config/packages/logbook.yaml with the following contents:

// config/packages/logbook.yaml

logbook:
    api:
        # The base url of the logbook app.
        url: "https://logbook.com"
        # The API key of logbook client app.
        key: "4eaa39a6ff57c4d5b2cd0a..."

    # Instance ID is a unique identifier per instance of your apps.
    instance_id: "default"

Make sure to replace the url value with the actual URL of your LogBook installation, and the key value with the API key that was generated for your app.

Register the health status check route, it will be accessed by the logbook to check the health status of the application. To register it in your Symfony application, add the following configuration to your config/routes/logbook.yaml file:

// config/routes/logbook.yaml

logbook_health:
    resource: "@LogbookBundle/Resources/config/routes.yaml"
    prefix: /logbook-health

Finally, configure the security for the health status check route in your Symfony application by adding the following configuration to your config/packages/security.yaml file:

security:
    providers:
        // ...
        logbook_provider:
            id: Solvrtech\Logbook\Security\LogbookUserProvider

    firewalls:
        health_check:
            pattern: ^/logbook-health
            stateless: true
            provider: logbook_provider
            custom_authenticator: logbook.authenticator

Submitting logs

The process of submitting logs to LogBook involves defining a logbook handler on the monolog configuration in your Symfony application. This can be done by adding the following configuration to your config/packages/monolog.yaml file (see Writing Logs to different Locations):

monolog:
    handlers:
        // ...
        logbook:
            # passed *all* logs
            type: stream
            # passed only log with debug level or higher
            level: debug

By using the level config above, you can specify the minimum log level that will be submitted to your LogBook installation. The ordered log levels are (from low to high):

  1. DEBUG

  2. INFO

  3. NOTICE

  4. WARNING

  5. ERROR

  6. CRITICAL

  7. ALERT

  8. EMERGENCY

For example, if you set level: warning, then only higher log levels such as WARNING, ERROR, CRITICAL, ALERT, and EMERGENCY are going to be submitted to your LogBook installation. To submit log messages in your code, you can inject the default logger into your controller or service and use it. For example:

use Psr\Log\LoggerInterface;

public function index(LoggerInterface $logger)
{
    $logger->info('I just got the logger');

    // include extra "context" info in your logs
    $logger->critical('I left the oven on!', [
        'cause' => 'in_hurry',
    ]);

    // ...
}

For more information on how to use the LoggerInterface, you can refer to its documentation.

You application version

Application version is one of the parameters that symfony-logbook will send to your LogBook installation. Make sure to set the version in your Symfony app’s /config/service.yaml file:

// config/services.yaml

// ...

Parameters:
    // ...
    version: "1.0.0"

It's worth noting that while it's recommended to set the application version parameter in your Symfony app's configuration, it is not a required step to use symfony-logbook. If the parameter is not set, symfony-logbook will still function normally, but the version information will not be available in the logs

V. Changelog

Version 1.0.0:

  • Initial release.